01
Customize the grid
Choose the paper style and spacing that fit the sketch before you draw.
- Square, dot, isometric, or lined paper
- 5 mm, 10 mm, or 20 mm grid spacing
- Optional X/Y axes in Graph and Dot views
Graph
Dot
Isometric
Lined
Use Ctrl and scroll to zoom the canvas. Hold Ctrl and drag an empty area to pan.
Browser-Based Drawing Tool
Use this browser-based graph paper drawing tool for quick sketches, diagrams, layouts, and coordinate drawings. Choose a paper style, set the grid to 5 mm, 10 mm, or 20 mm, turn on grid or 15-degree angle snapping, and start drawing immediately.
Your drawing data is processed and autosaved in your browser; this tool does not upload the canvas. Export the current view as PNG or SVG, print it directly, or choose Save as PDF from the print dialog.
A simple workflow
Set up the drawing surface, add the marks you need, and export the visible canvas without leaving the page.
Choose the paper style and spacing that fit the sketch before you draw.
Build the drawing with simple tools, then use snapping to keep it tidy.
Keep the result on your device and choose the format that suits the next step.
Common uses
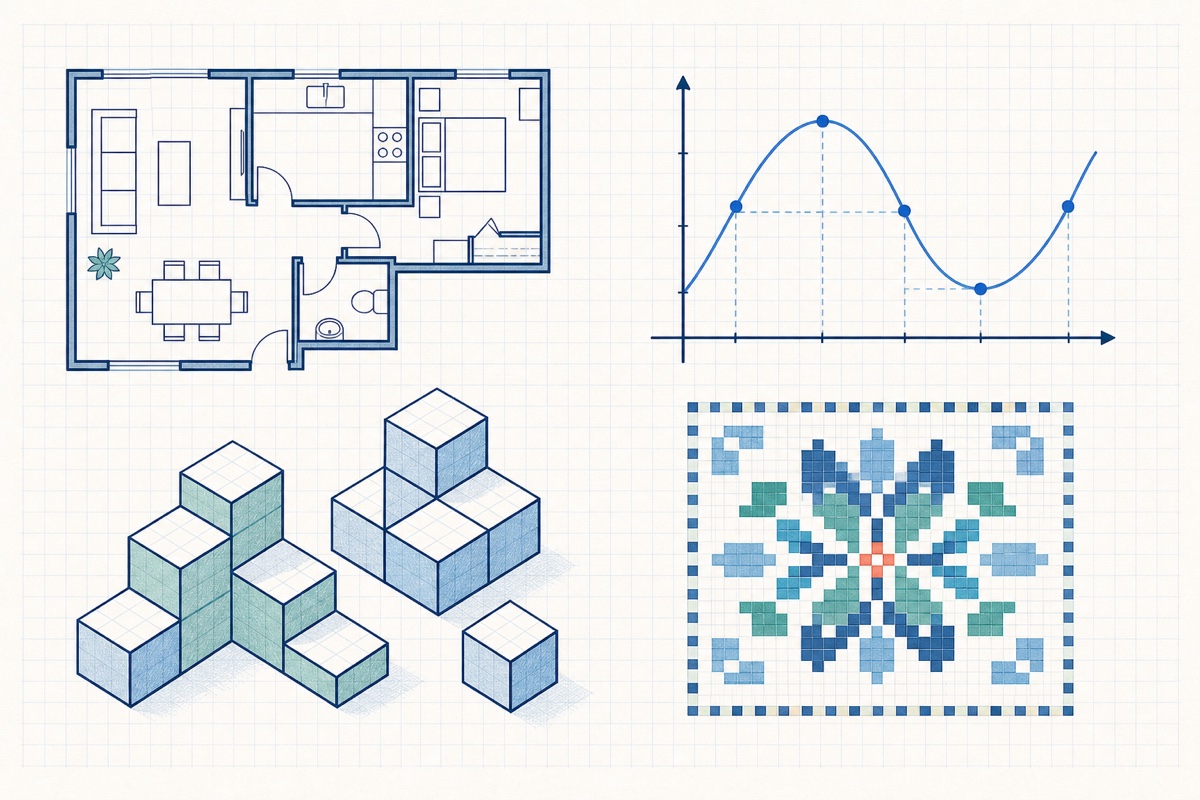
An adjustable grid helps keep proportions consistent across planning, learning, design, and craft work—without turning a quick sketch into a full CAD project.
Floor plans, room layouts, and bullet journal pages.
Coordinate geometry, classroom notes, and math exercises.
Isometric blocks, flowcharts, wireframes, and technical sketches.
Cross-stitch plans, pixel art, and repeatable craft patterns.
Browse printable pixel art gridsQuestions & Answers
Short answers about measurements, privacy, coordinate drawing, and the available export options.
Measurement note
Grid spacing is a planning reference. The tool does not automatically measure lines or add dimension labels.
Virtual graph paper is an online drawing canvas with a customizable grid behind it. You can draw directly on the page, align objects to the grid, add axes or labels, and then save or print the current view.
It provides selectable 5 mm, 10 mm, and 20 mm grid spacing, so each square on the square grid can represent a consistent unit in your drawing. It does not measure lines or add dimension labels automatically, and printed physical size can vary with browser print scaling.
No. Your canvas data is processed and autosaved in your browser, and this drawing tool does not upload it. PNG and SVG files are generated on your device.
Yes. Select Print to open your browser's print dialog. Available paper size, orientation, margins, and scaling options depend on your browser and operating system.
Yes. Select Graph or Dot, then enable Show X/Y axes to display a coordinate plane. You can plot points by hand, draw shapes, and make coordinate geometry sketches.
Use Print and choose Save as PDF in your browser or operating system print dialog. For blank printable sheets, use the graph paper generators.
Yes. You can export the current canvas view as PNG or SVG. PNG is convenient for sharing or inserting into documents, while SVG is better when you need a scalable vector file.