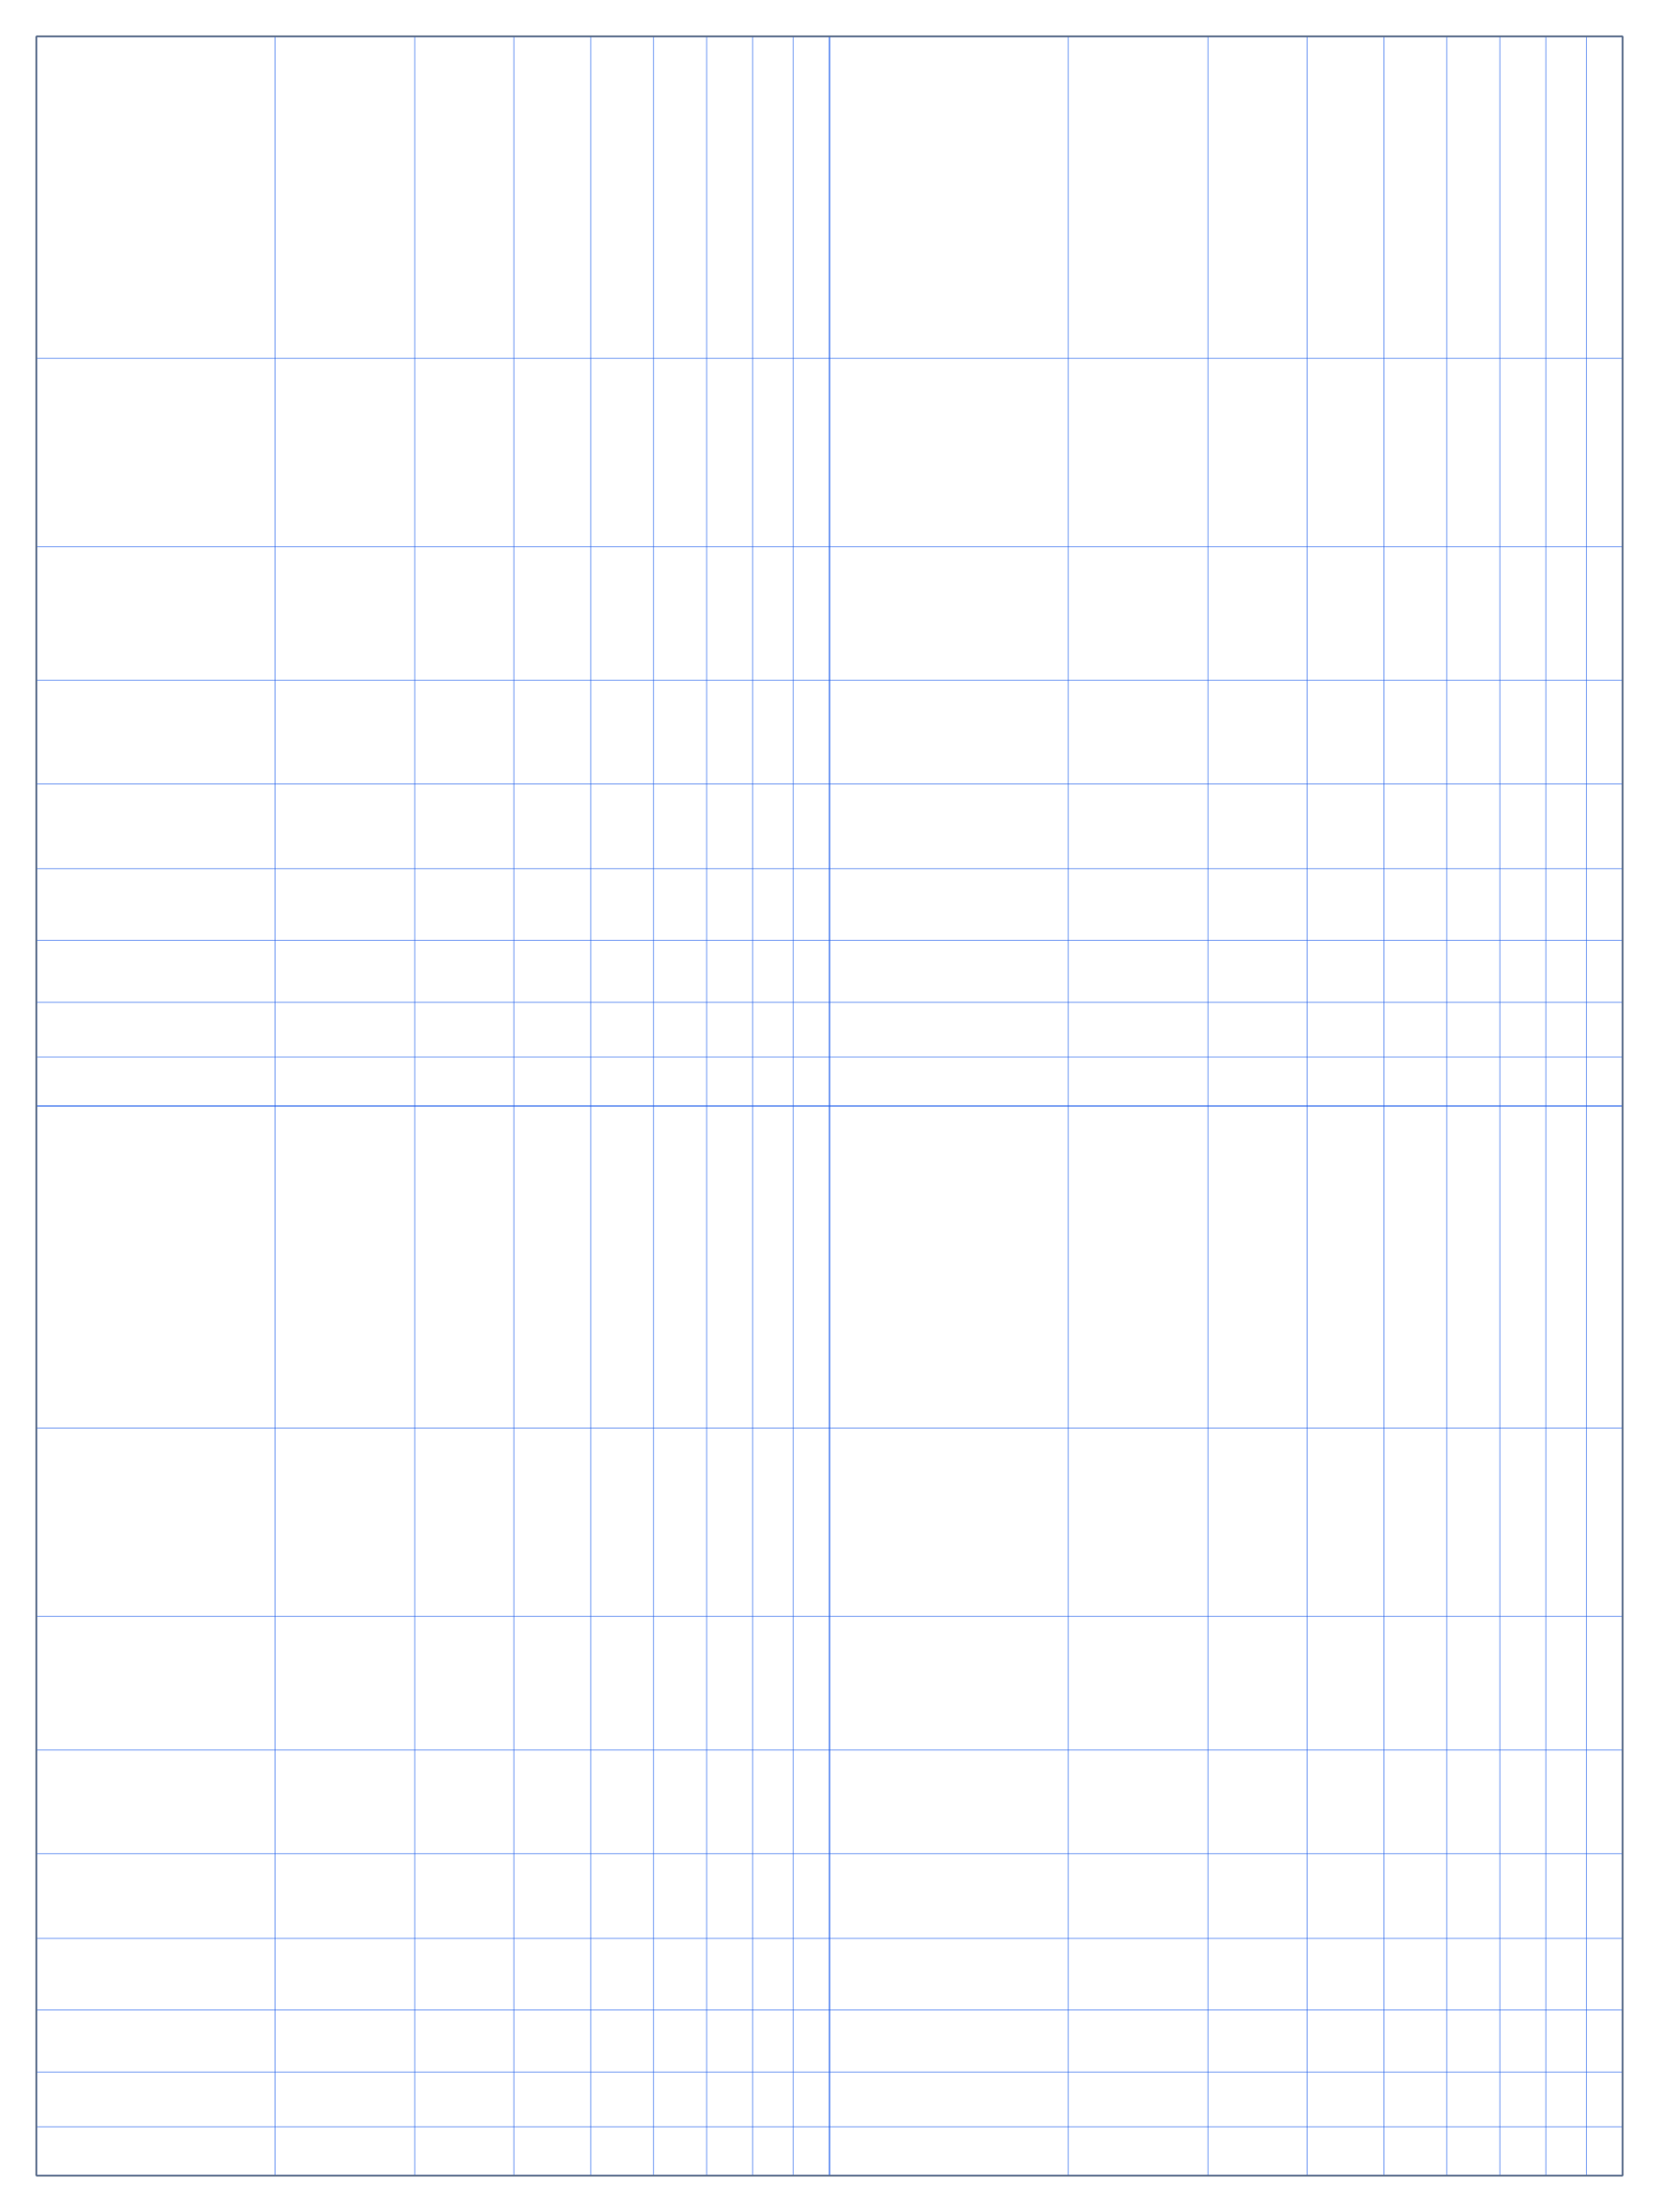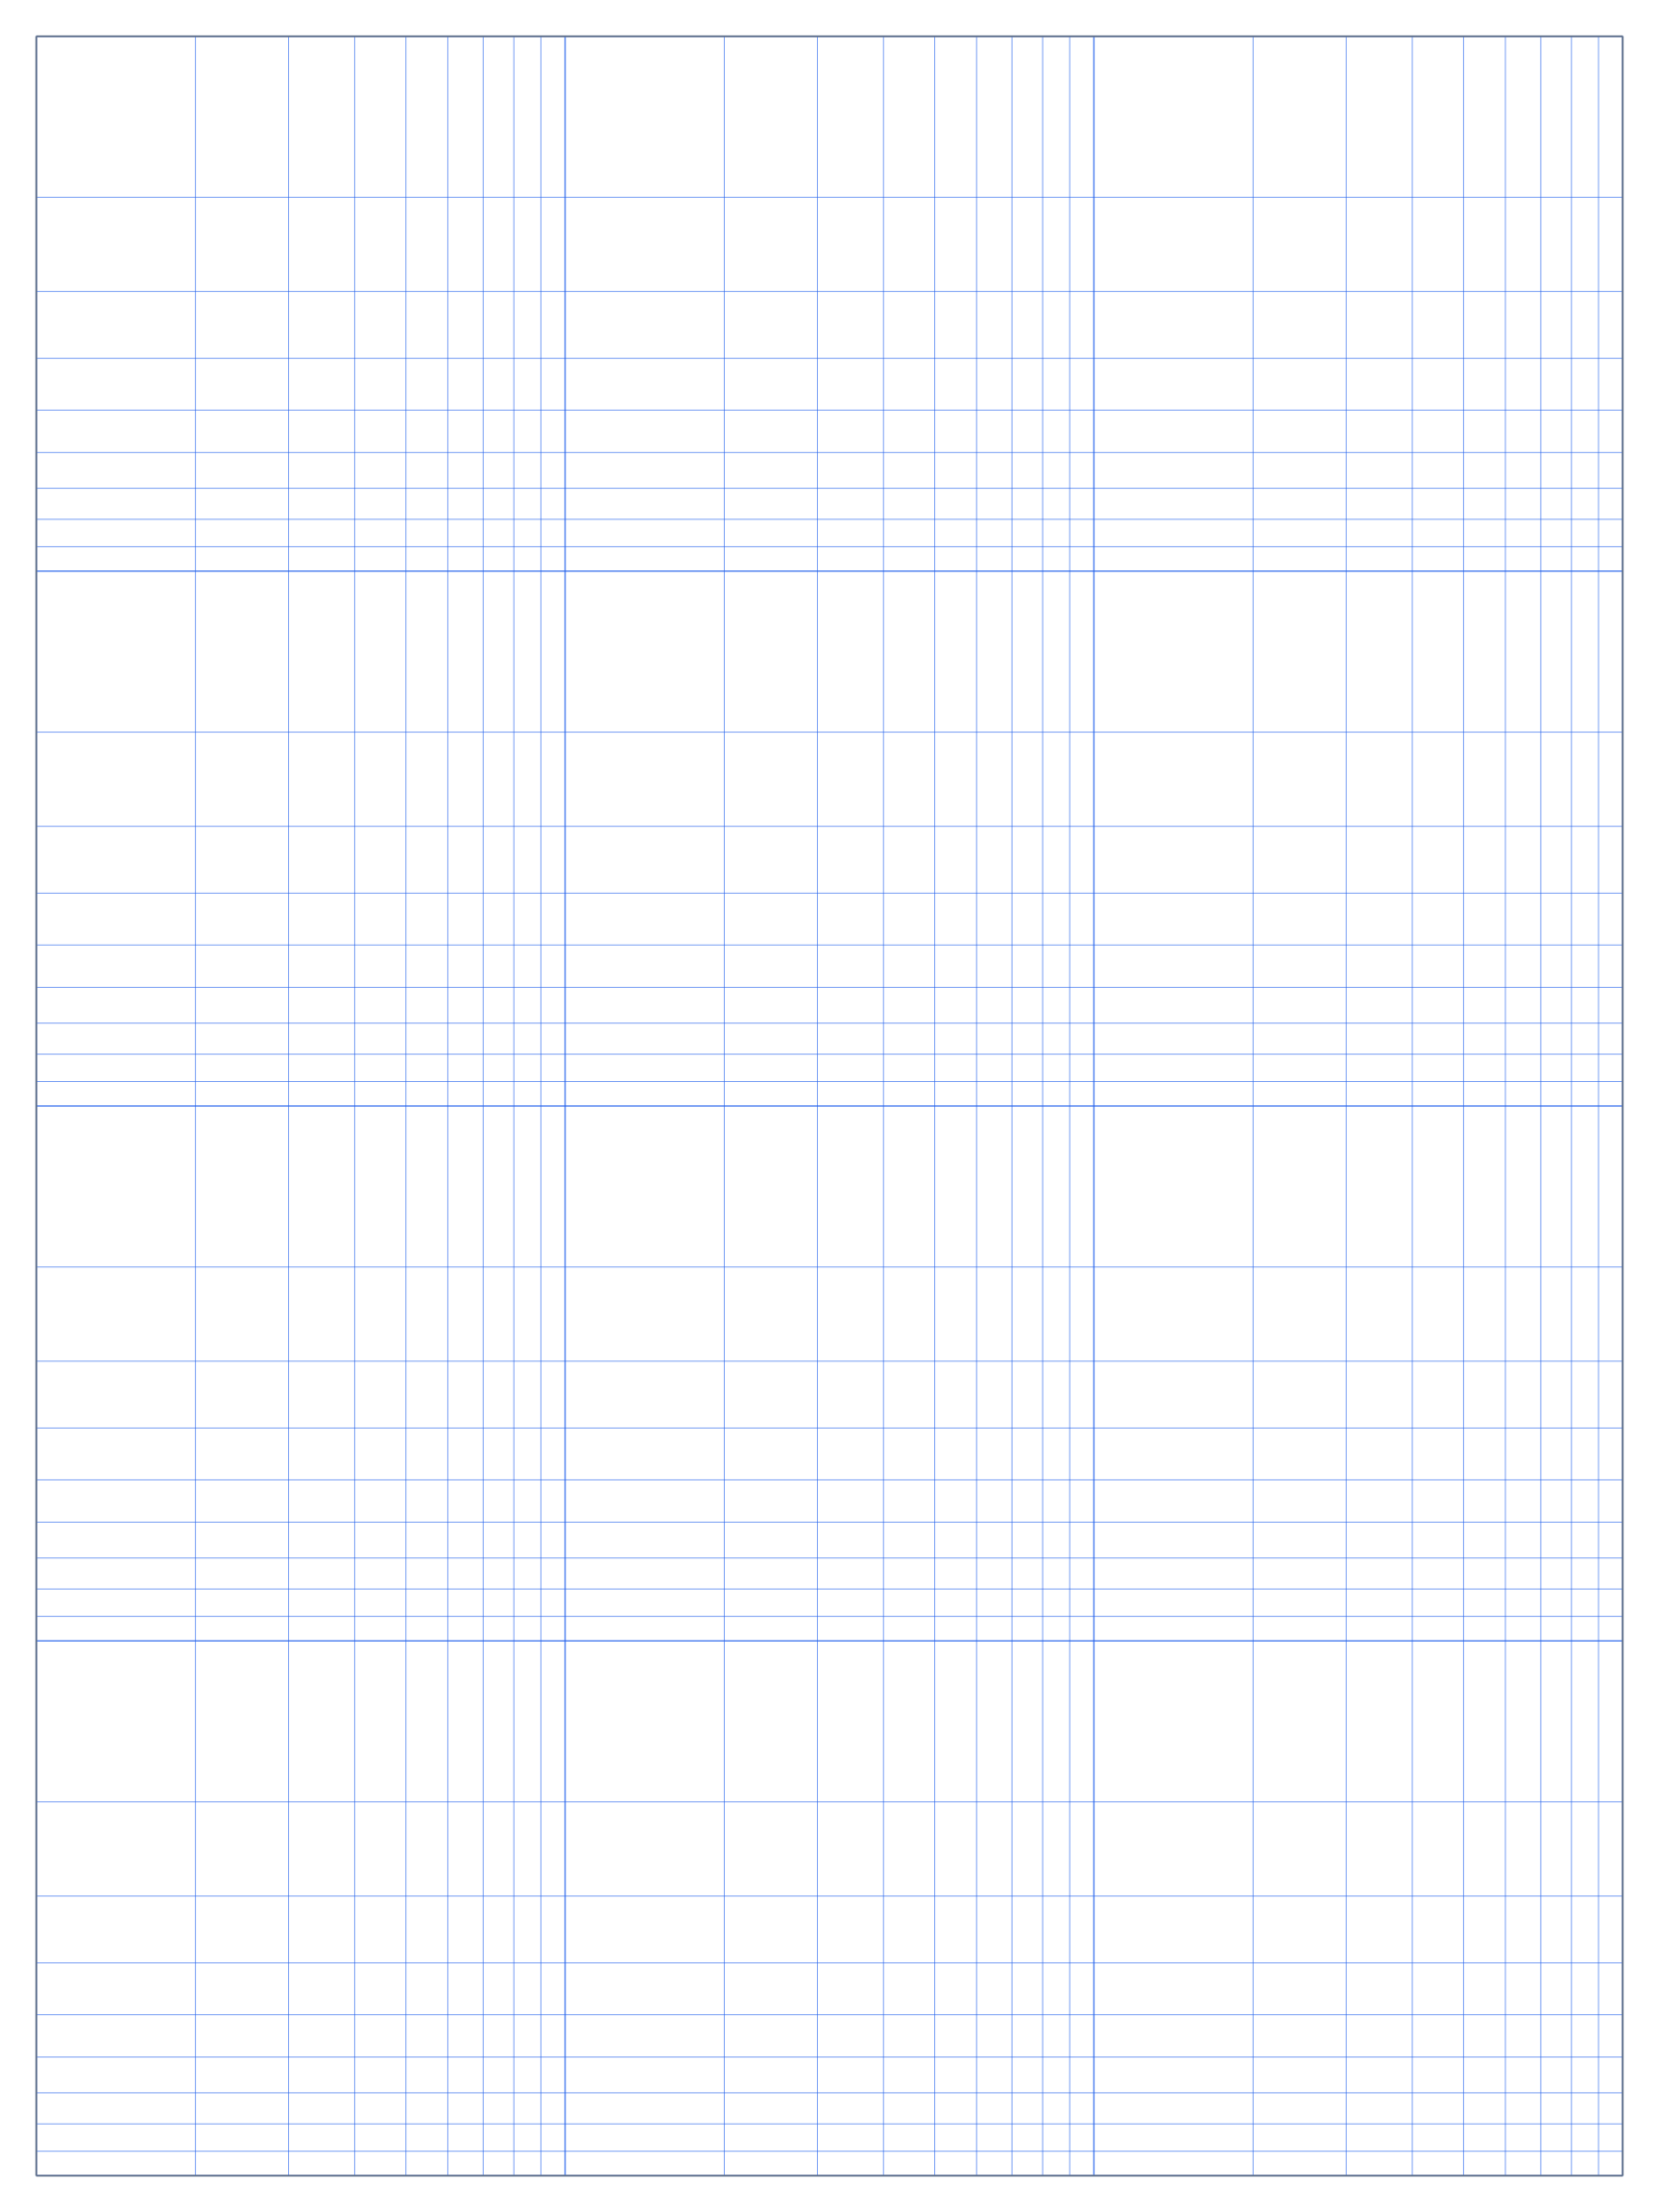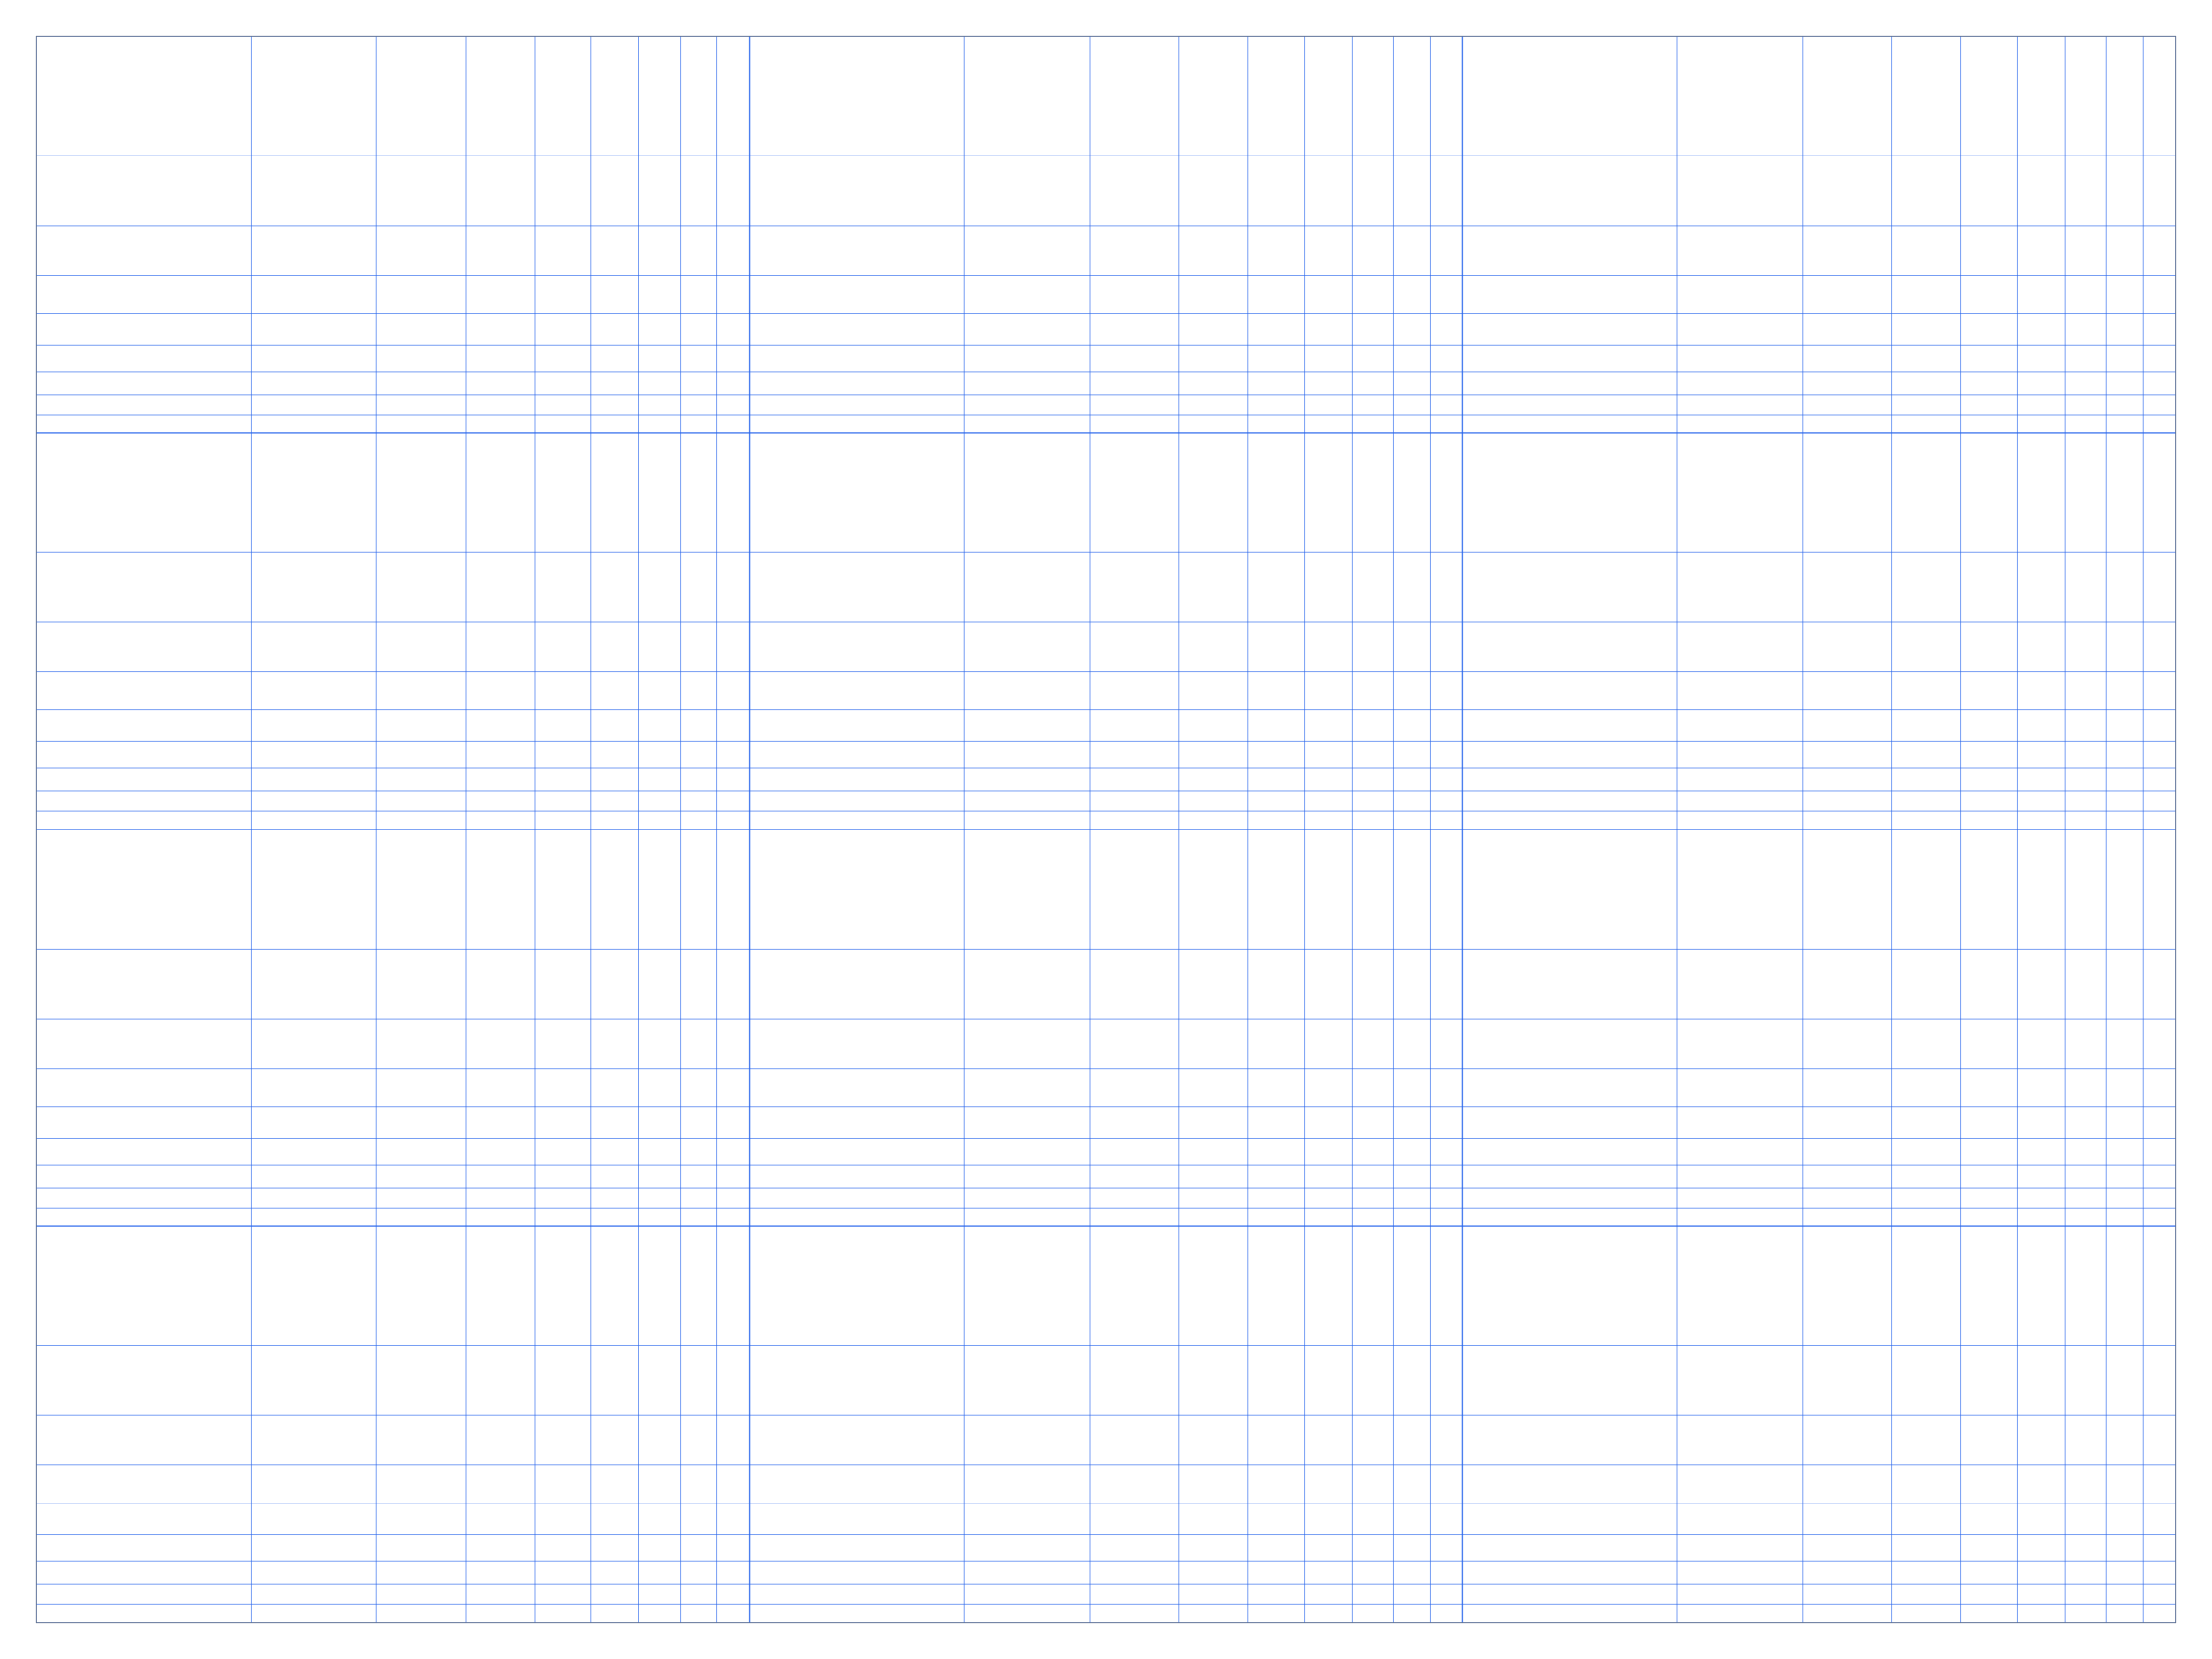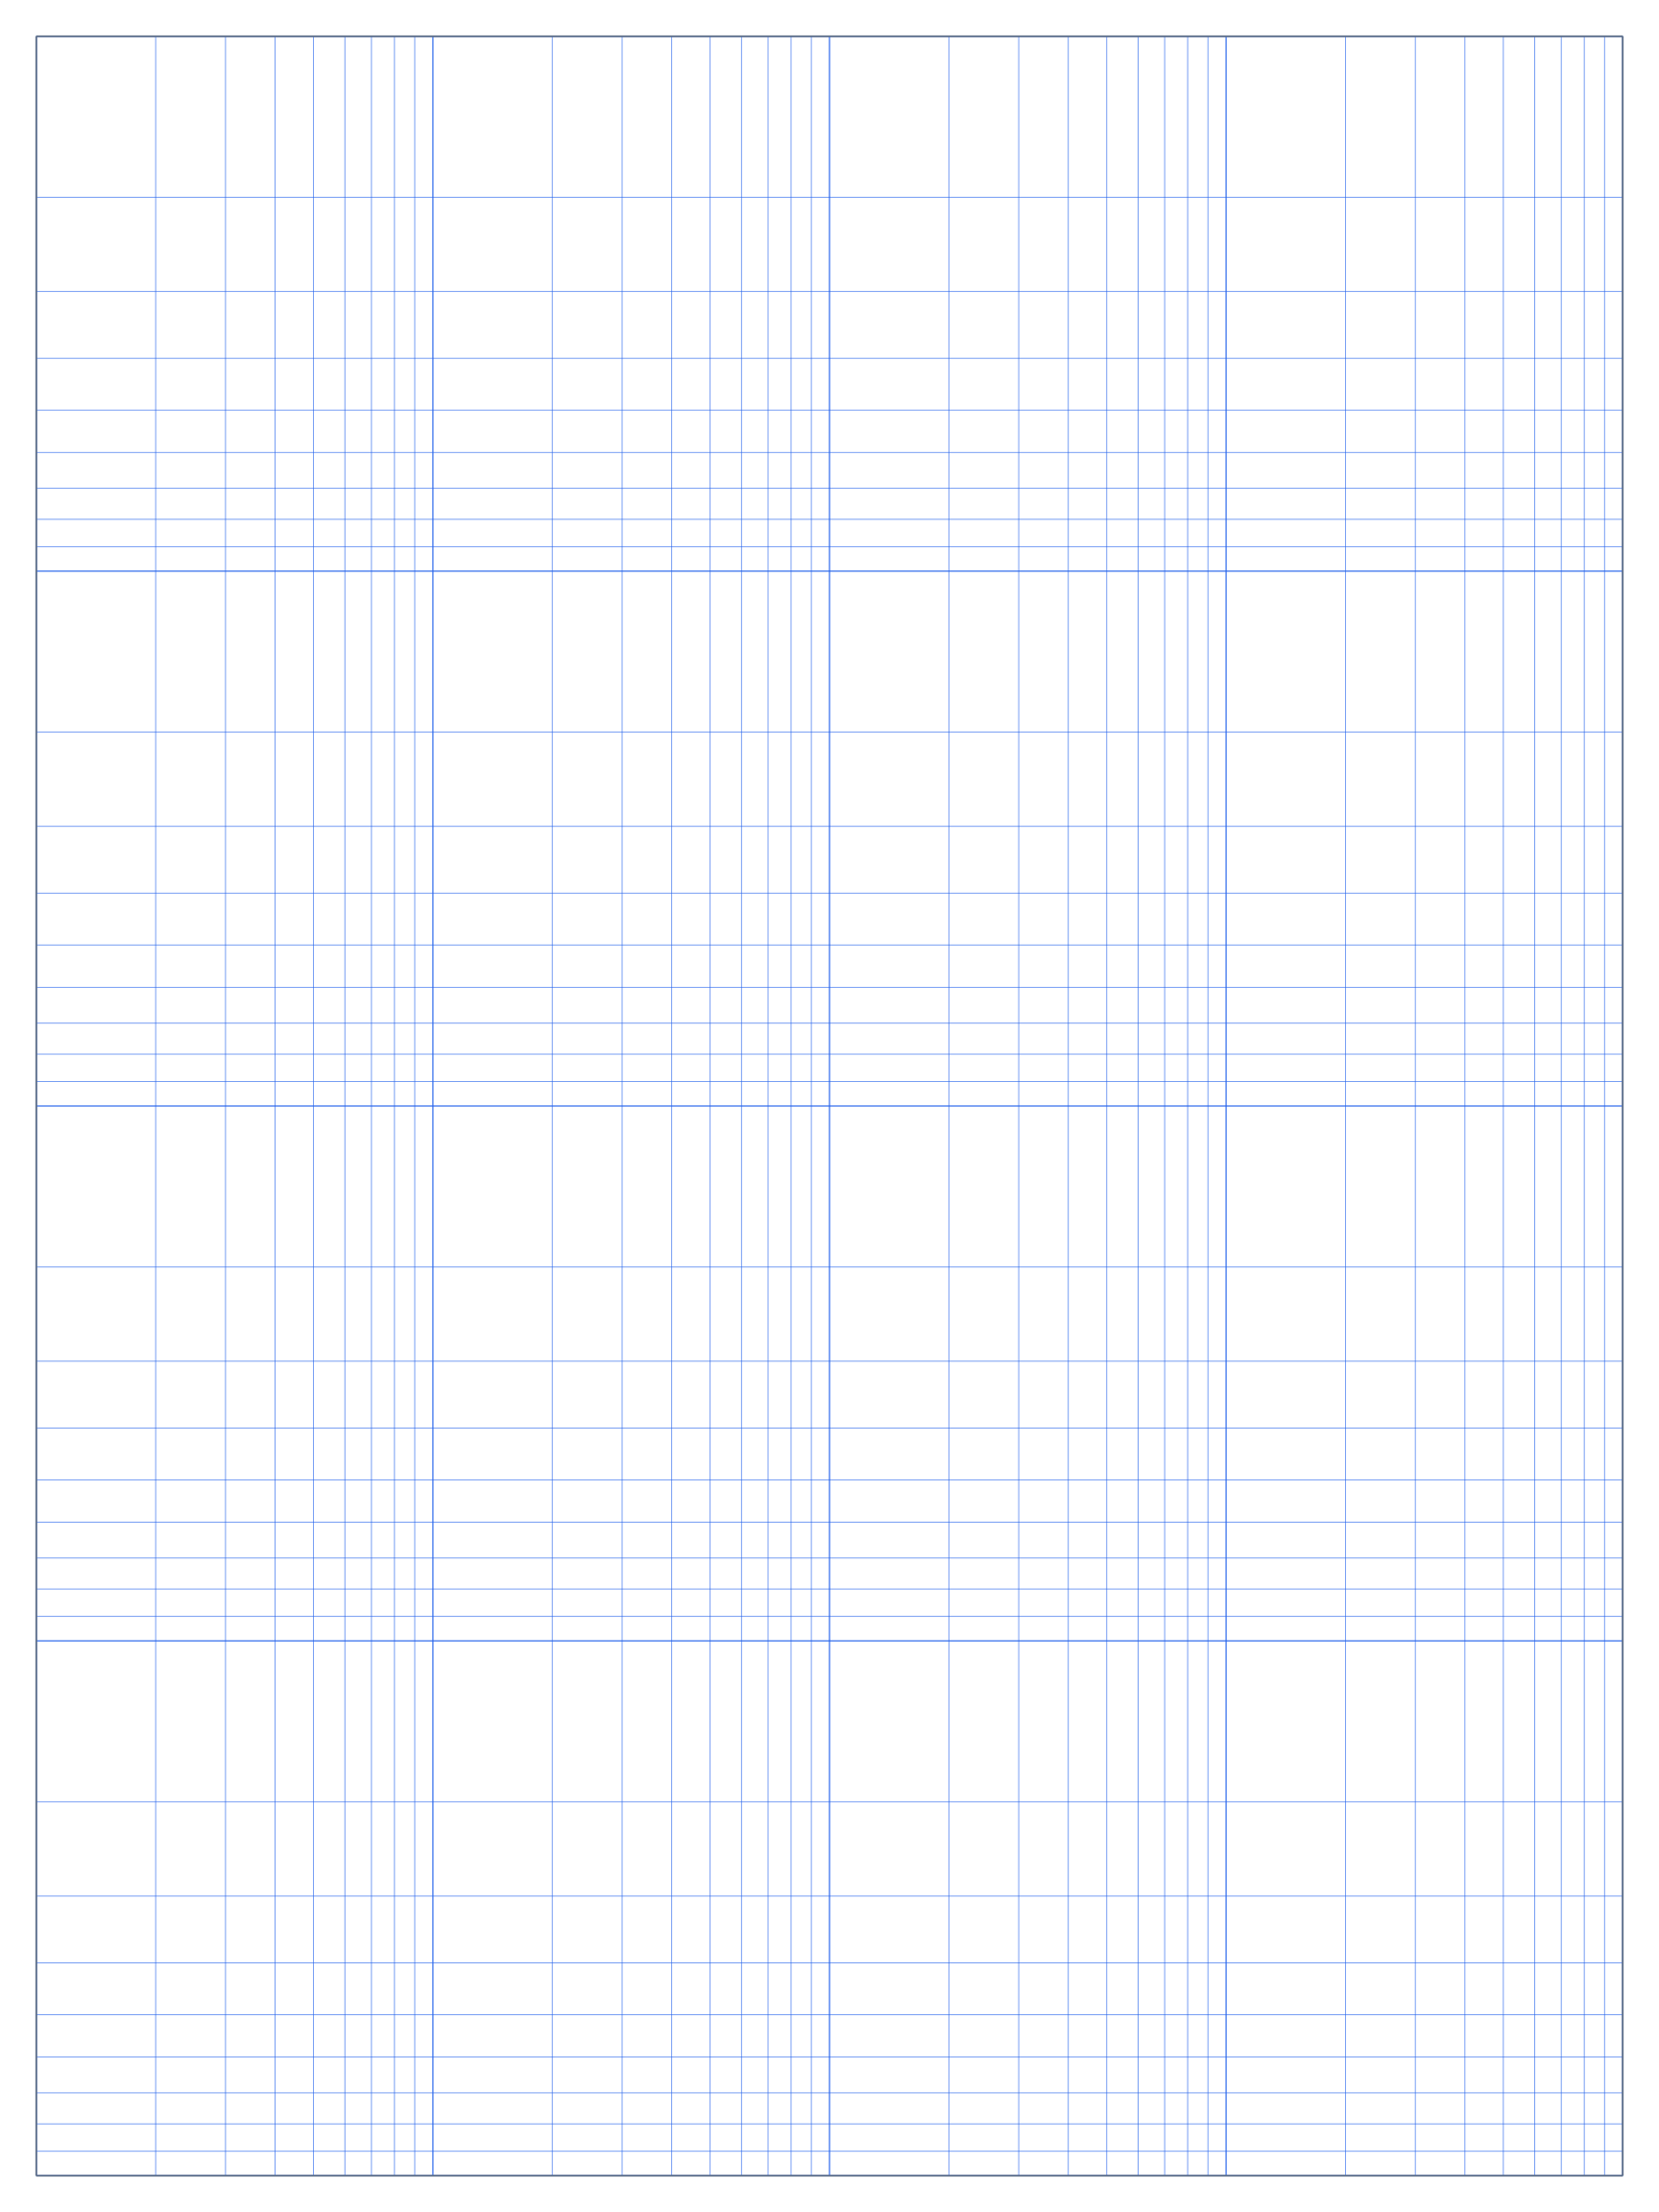
Poster 2 x 2 cycles Log-Log Graph Paper PDF
Poster portrait | 2 x 2 cycles | Base 10 | Blue grid
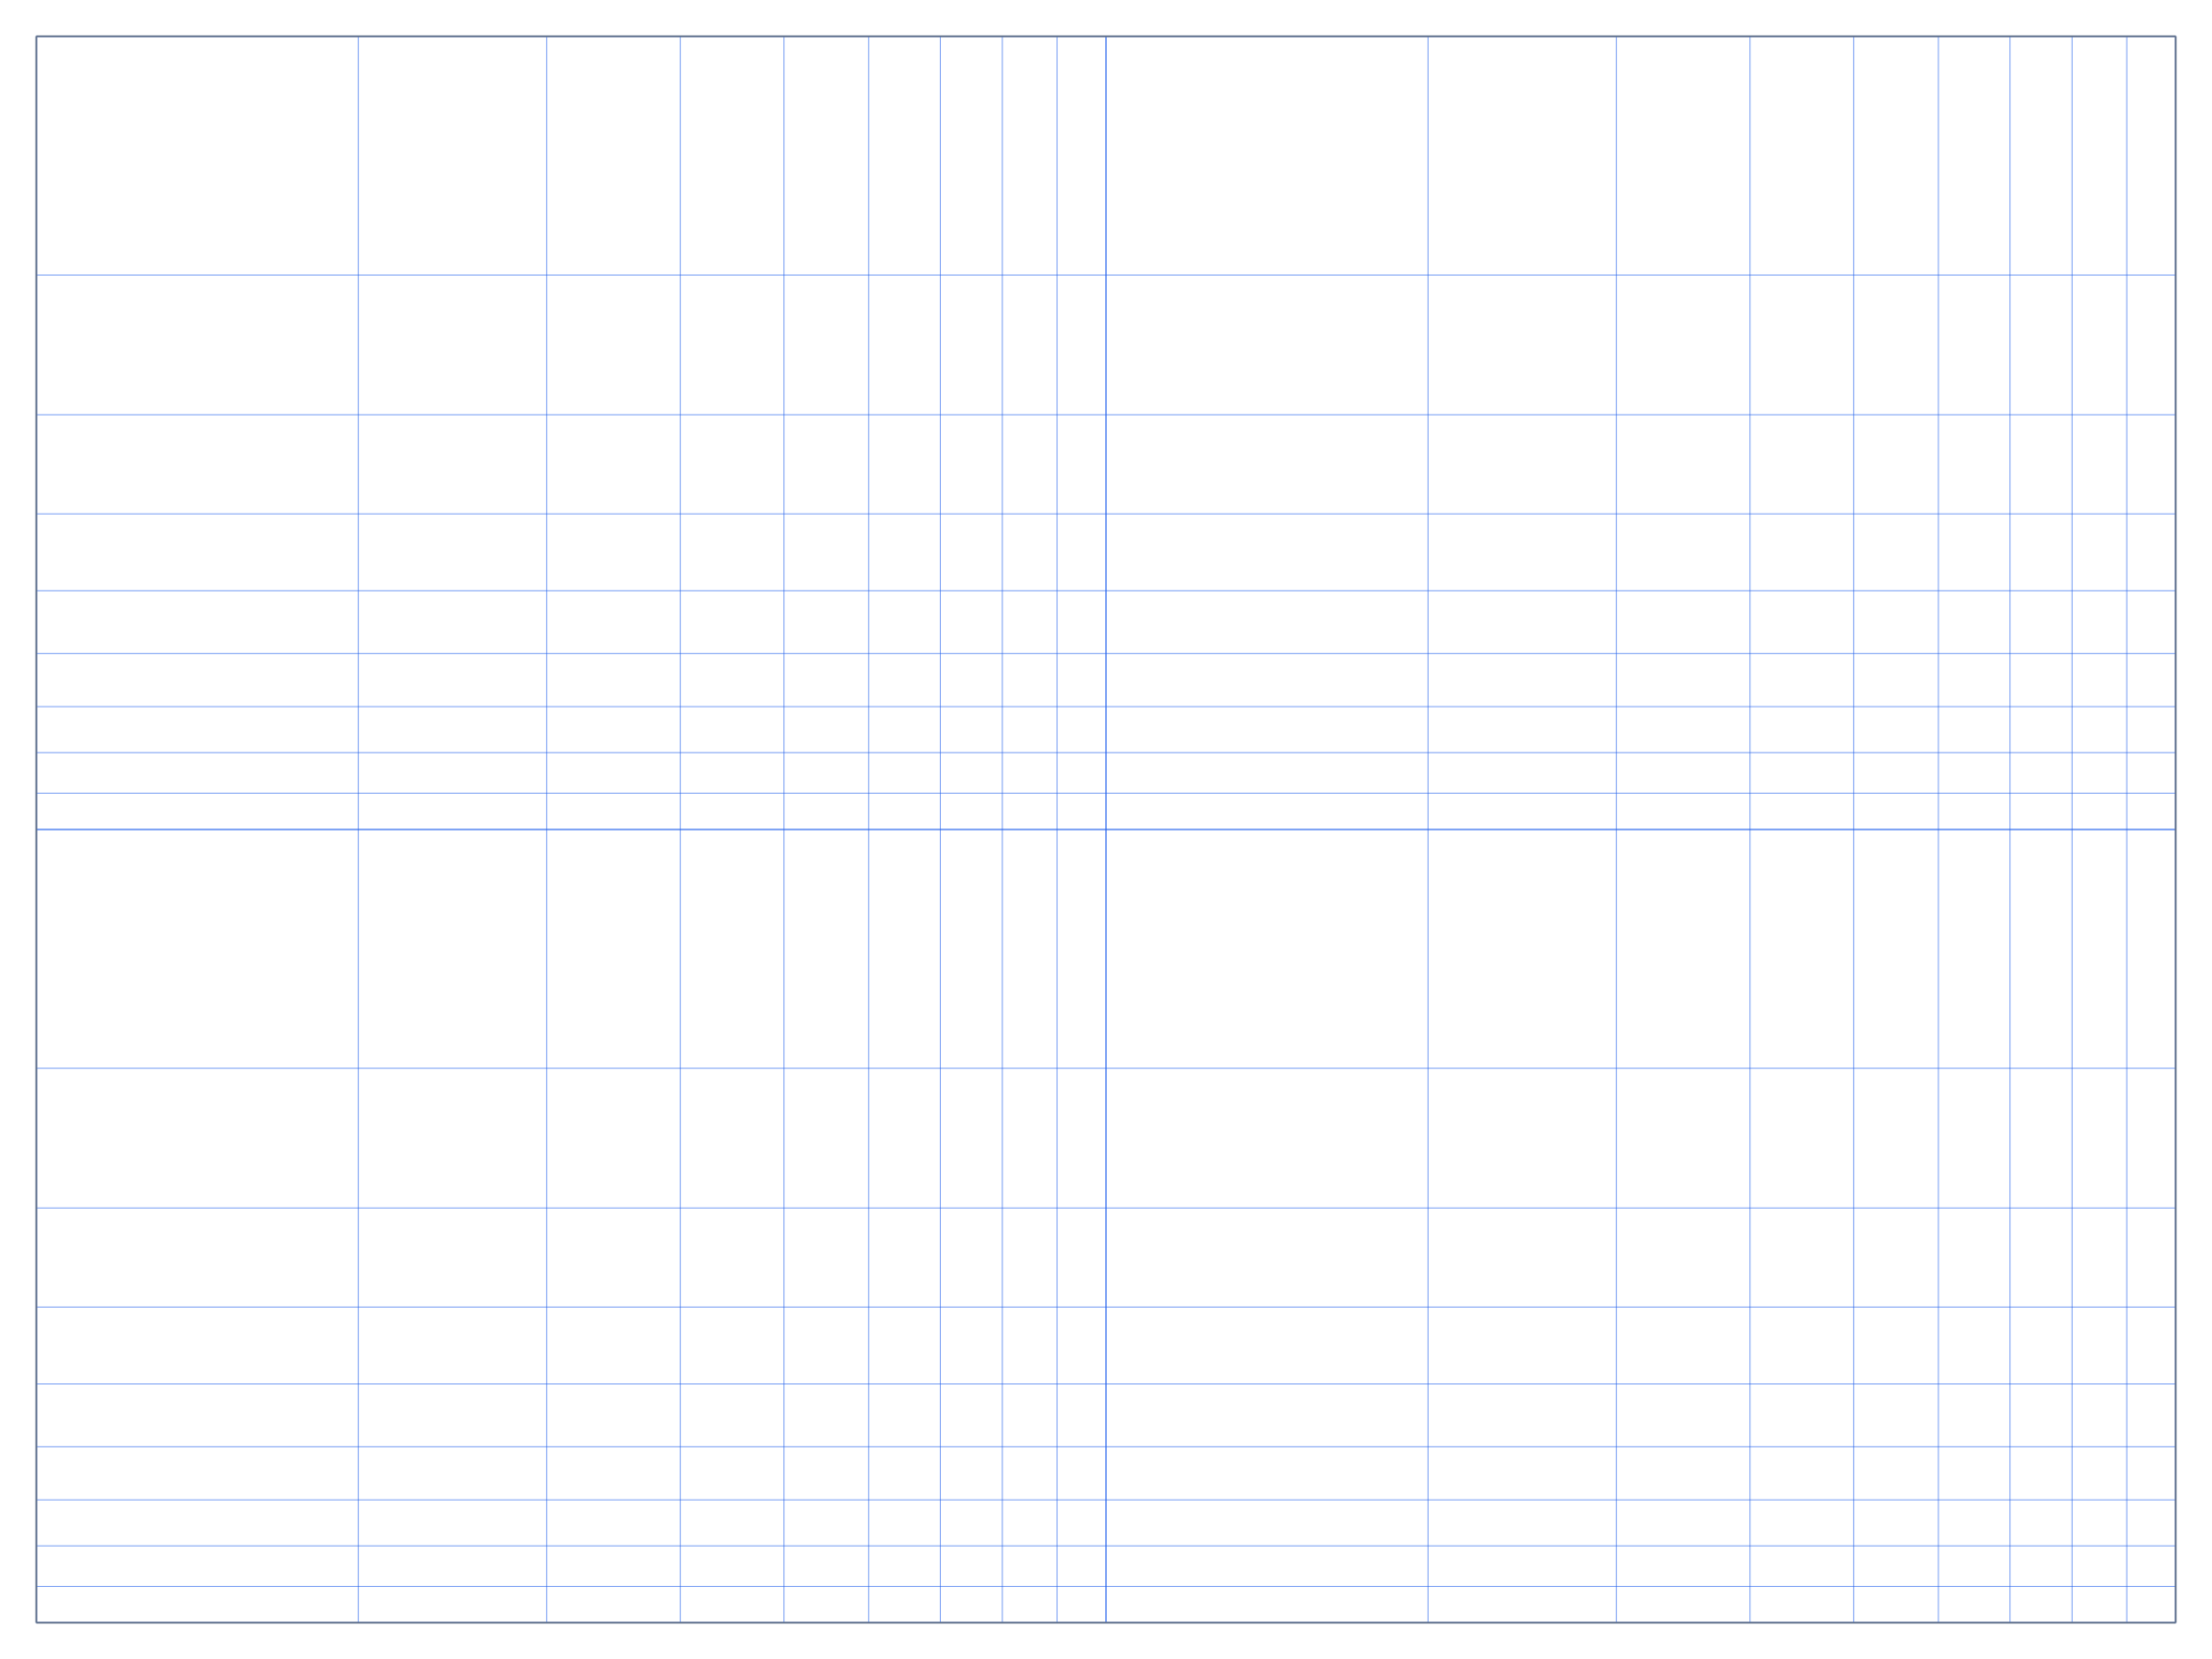
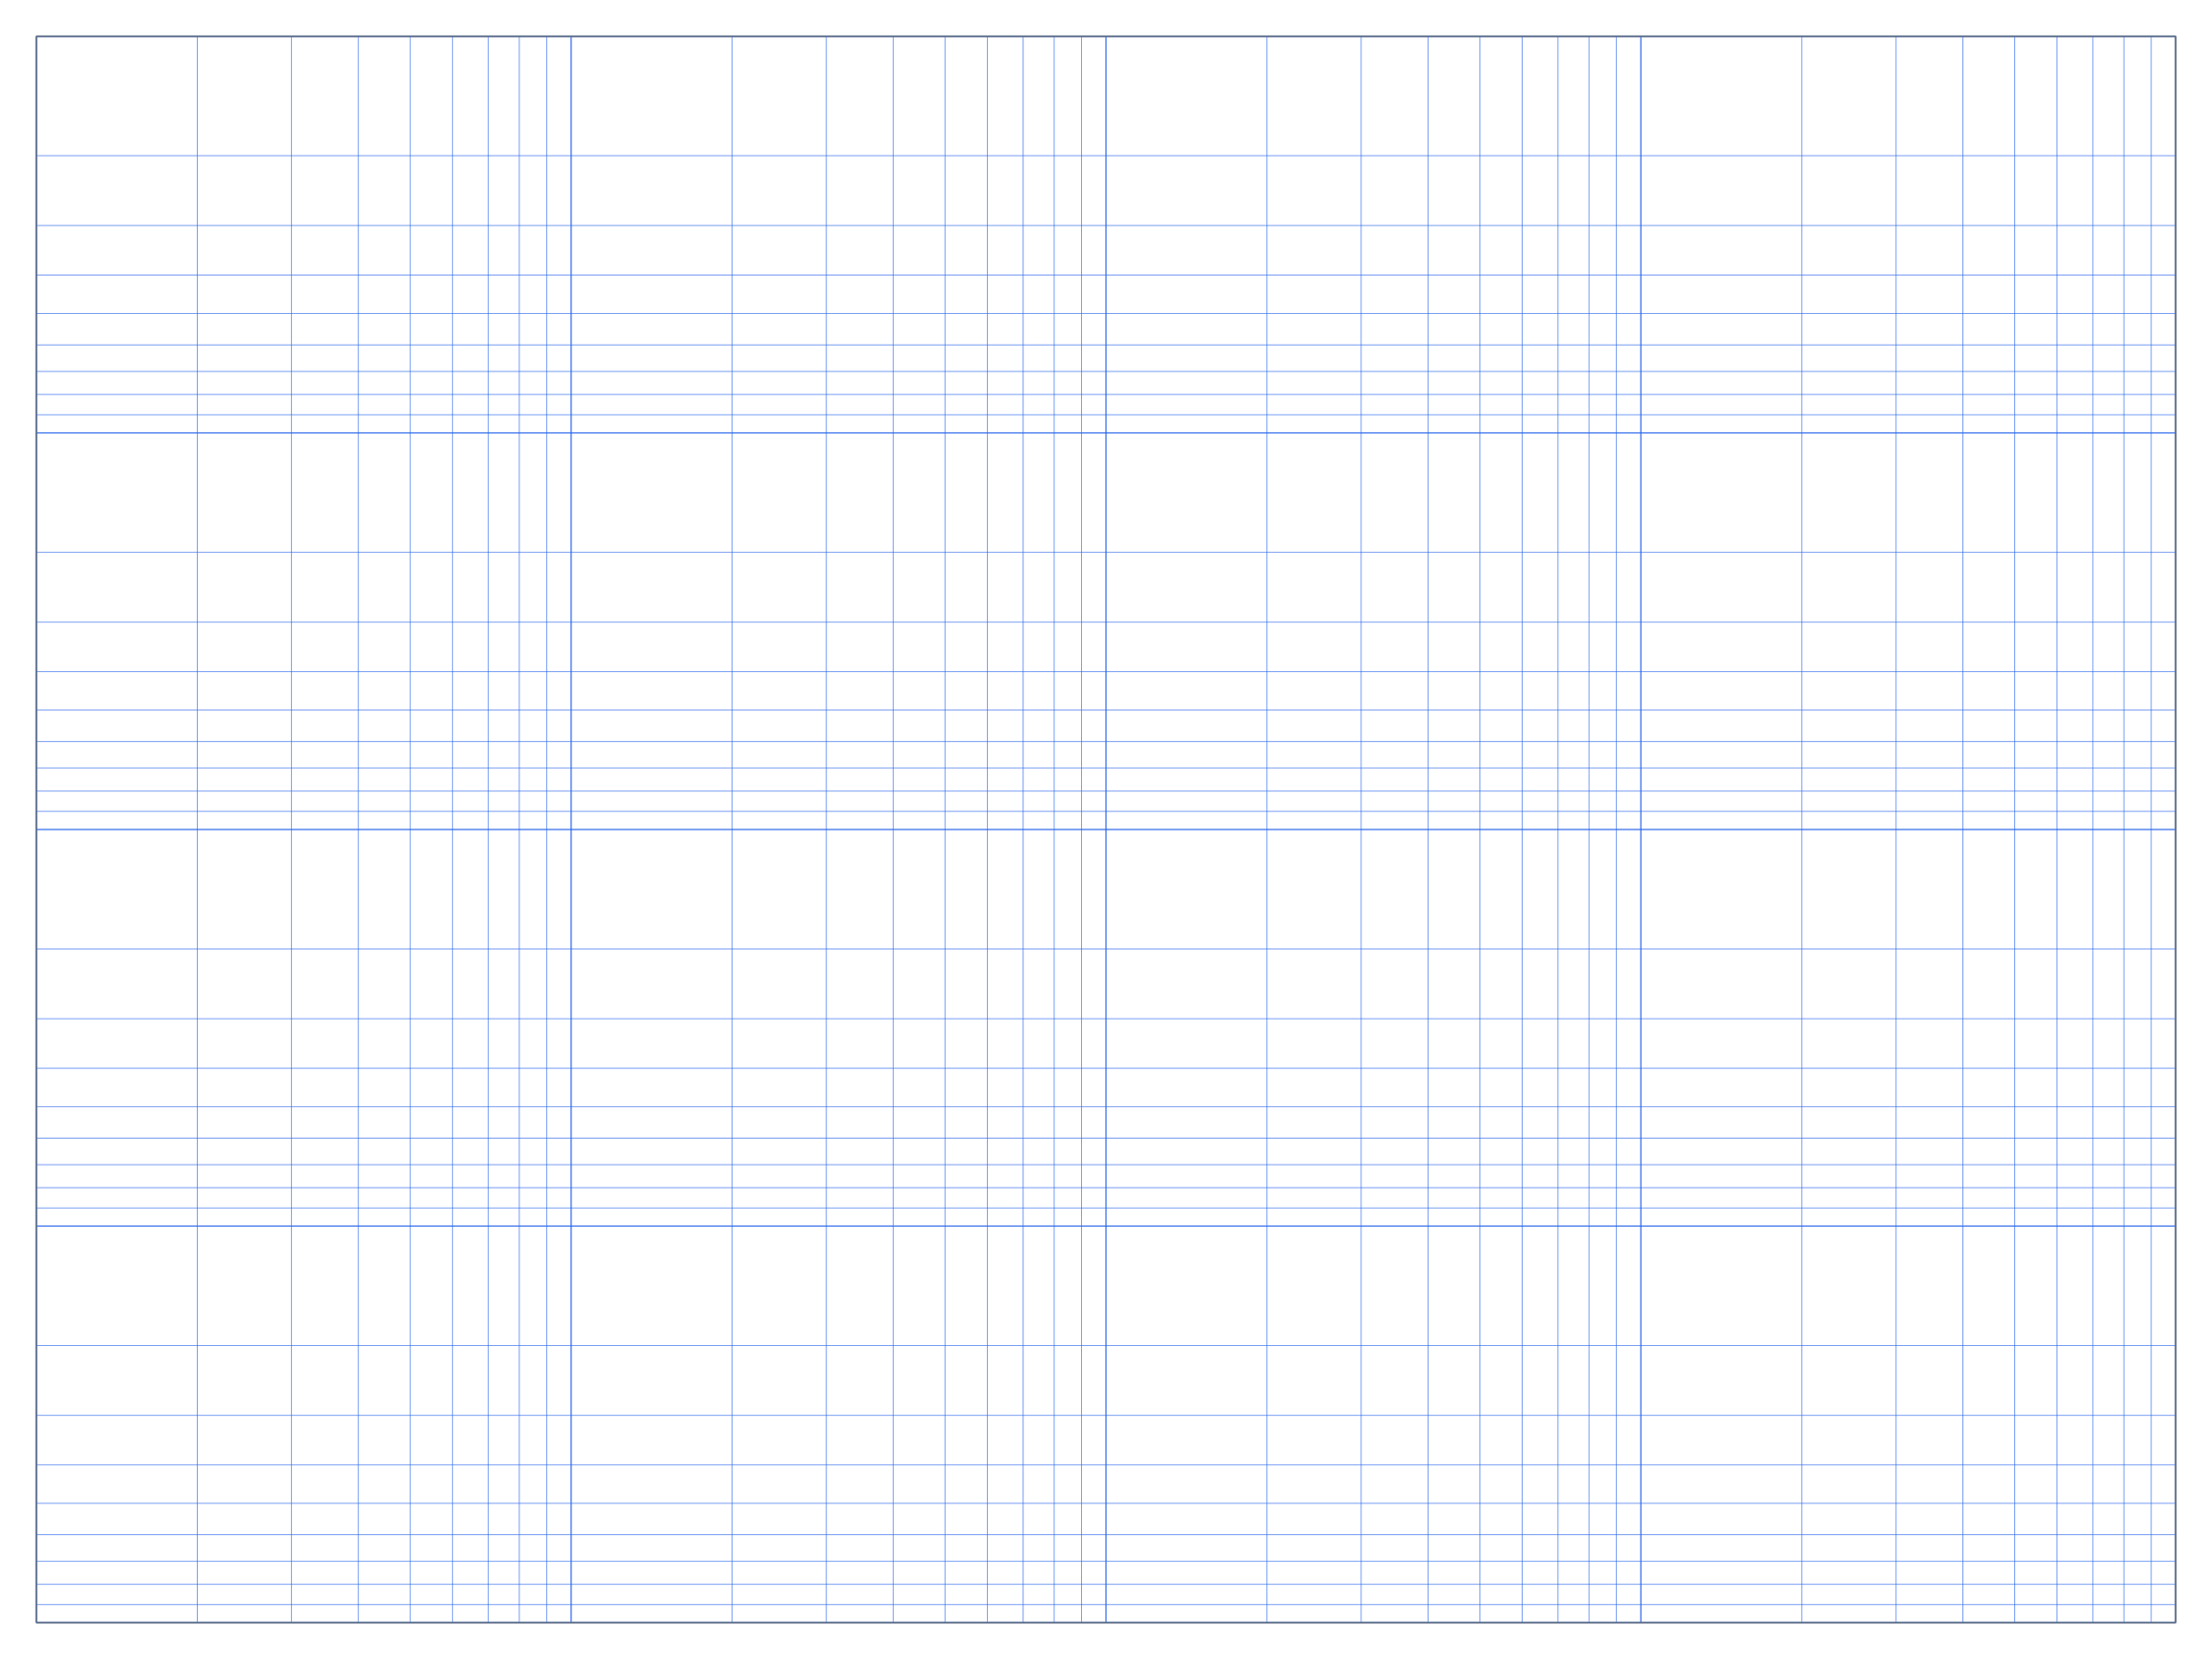
Poster landscape log-log paper
This Poster landscape base-10 template provides 2 logarithmic cycles on the X-axis and 2 on the Y-axis. It can cover 1 to 100 horizontally and 1 to 100 vertically when both axes begin at 1, on a 18 x 24 inch page.

Template details
Poster paper creates a large continuous grid for work that needs to be viewed, marked, or discussed from a distance. This template uses base-10 logarithmic spacing on both axes, with 2 cycles horizontally and 2 cycles vertically.
If each axis begins at 1, the X-axis can cover 1 to 100 and the Y-axis can cover 1 to 100. The same grid can begin at any other power of ten that fits the data.
Log-log paper is useful when both variables span wide ranges or a power-law relationship needs to be examined as a straight line.
Plot size scaling, material behavior, allometric data, inverse-square relationships, and other models where one variable is proportional to a power of another.
The 2 x 2 cycles layout spreads multiplicative changes across the page instead of crowding small values near the origin.
Poster is suited to wall charts, maps, displays, and large plans. The margins leave room for axis labels, units, a title, and notes.
Both formats keep the same base-10 cycle structure. Choose the sheet that matches the printer and the amount of physical room needed for plotted points and labels.
Open Tabloid (11 x 17) 2 x 2 cycles log-log paper →| Comparison | Poster | Tabloid (11 x 17) |
|---|---|---|
| Page size | 18 x 24 in (457.2 x 609.6 mm) | 11 x 17 in (279.4 x 431.8 mm) |
| Plotting area | 589.6 x 437.2 mm | 411.8 x 259.4 mm |
| Each X cycle | 294.8 mm | 205.9 mm |
| Each Y cycle | 218.6 mm | 129.7 mm |
Use the PDF when the page dimensions and consistent logarithmic subdivisions matter. Match the file to the paper loaded in the printer.
Select an 18 x 24 inch custom or poster page size. Use a large-format printer or a print service that supports this sheet.
Select Actual Size or 100% scale. Turn off Fit, Shrink, and Scale to Page options.
Keep the print dialog set to landscape so the graph is not rotated or reduced automatically.
Write the selected powers of ten at the major cycle boundaries. The minor subdivisions within each cycle represent 2 through 9 times its starting value.
10 ready-made templates are available for this paper size in portrait and landscape layouts.
Poster portrait | 2 x 2 cycles | Base 10 | Blue grid
Poster landscape | 2 x 2 cycles | Base 10 | Blue grid

Poster portrait | 3 x 3 cycles | Base 10 | Blue grid

Poster landscape | 3 x 3 cycles | Base 10 | Blue grid
Poster portrait | 3 x 4 cycles | Base 10 | Blue grid
Poster landscape | 3 x 4 cycles | Base 10 | Blue grid

Poster portrait | 4 x 3 cycles | Base 10 | Blue grid

Poster landscape | 4 x 3 cycles | Base 10 | Blue grid
Poster portrait | 4 x 4 cycles | Base 10 | Blue grid
Poster landscape | 4 x 4 cycles | Base 10 | Blue grid
Answers specific to using and printing 2 x 2 cycles log-log graph paper on Poster.
It contains 2 X-axis cycles and 2 Y-axis cycles. Starting at 1 gives ranges of 1 to 100 on X and 1 to 100 on Y, but either axis can begin at another power of ten.
Yes. Both the horizontal X-axis and vertical Y-axis use base-10 logarithmic subdivisions. Use semi-log paper when only one axis should be logarithmic.
Assign each major boundary a power of ten. Within a cycle, the minor lines represent 2 through 9 times the value at that cycle's beginning.
Select Poster paper, use Actual Size or 100% scale, and disable Fit to Page.
Portrait gives each Y-axis cycle more vertical room; landscape gives each X-axis cycle more horizontal room. Choose the layout that gives your more crowded axis extra space.