One log axis
Use semi-log paper when values change by powers of ten but one axis still needs normal linear spacing.
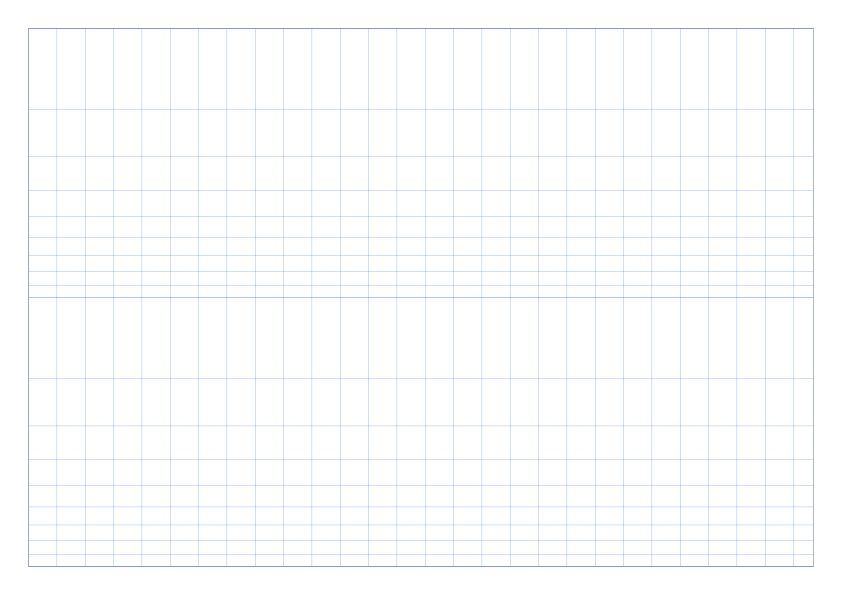
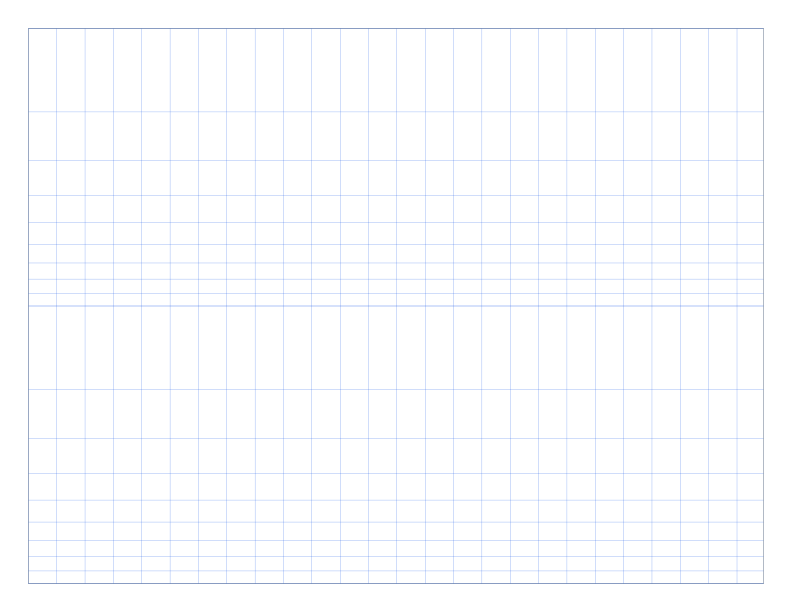
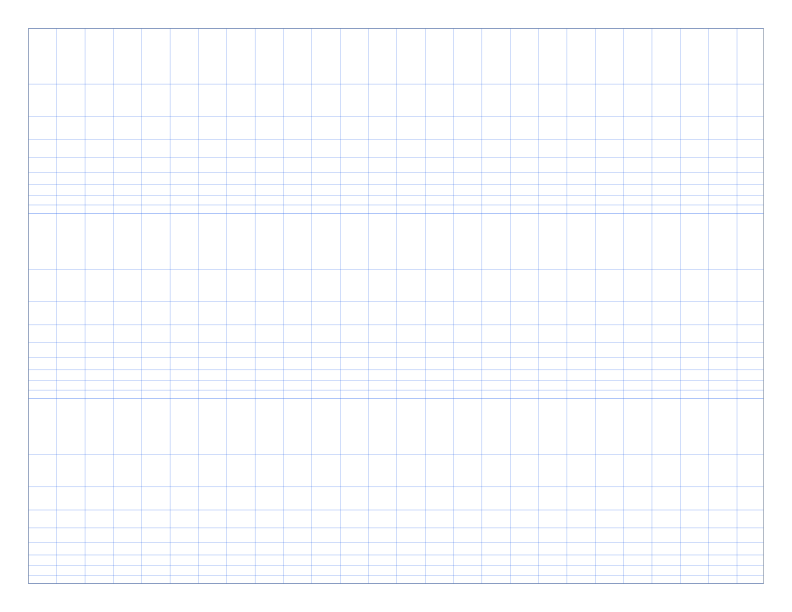
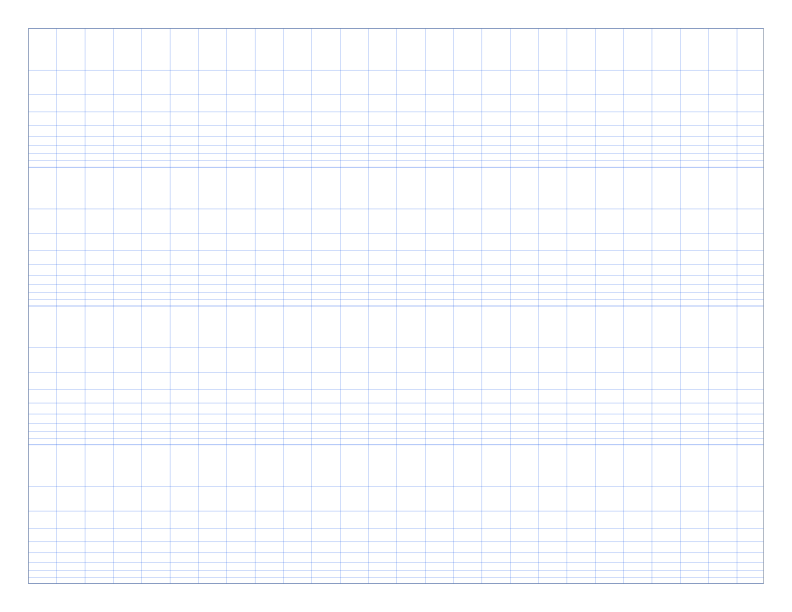
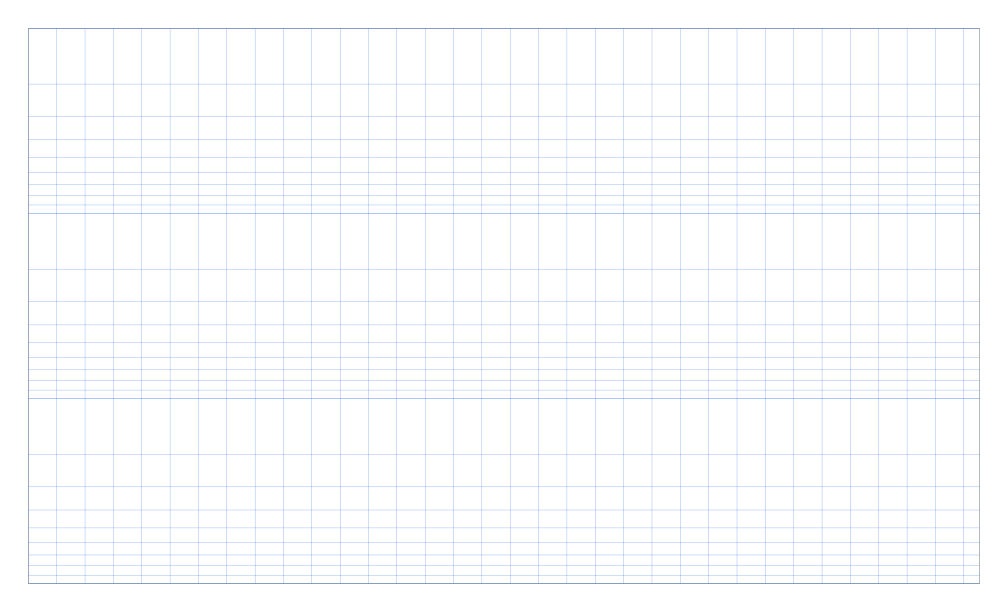
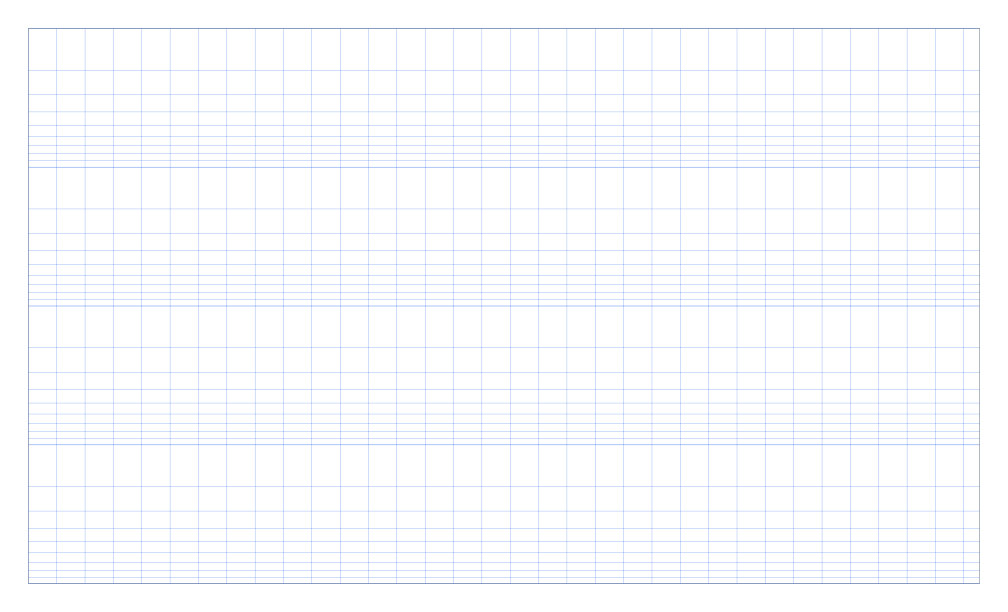
Semi-log paper uses one logarithmic axis and one linear axis, which makes exponential growth, decay, frequency response, and lab measurements easier to read.


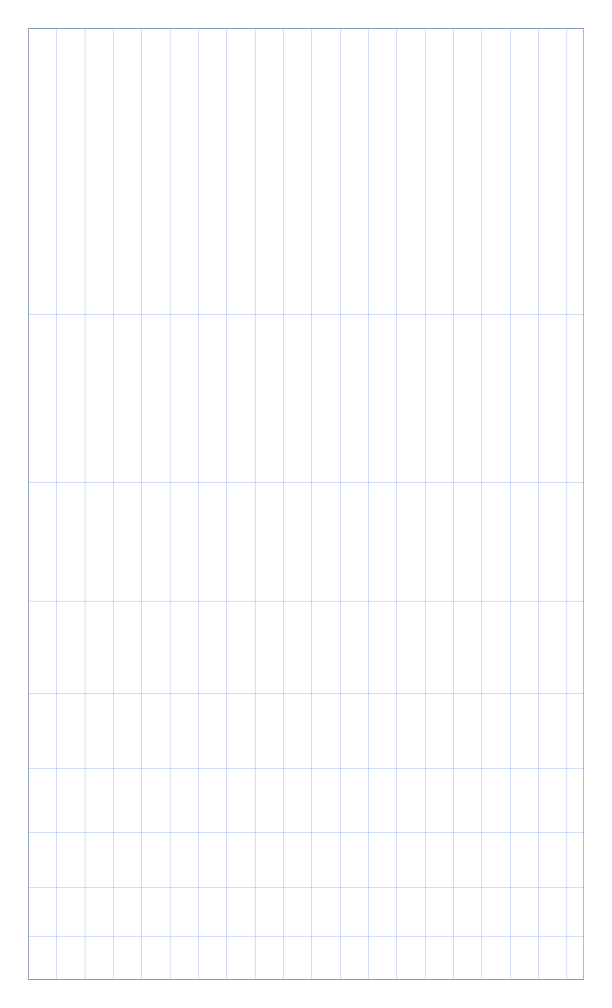


Use semi-log paper when values change by powers of ten but one axis still needs normal linear spacing.
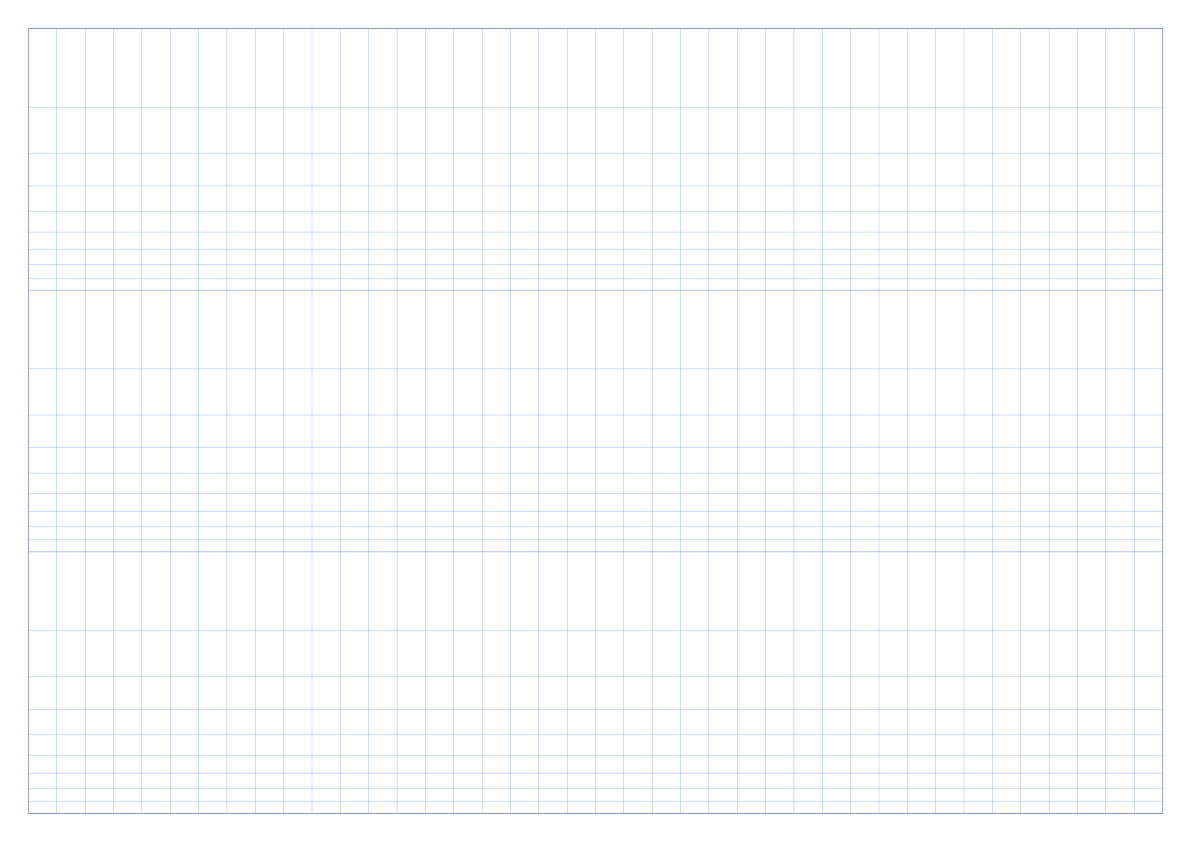
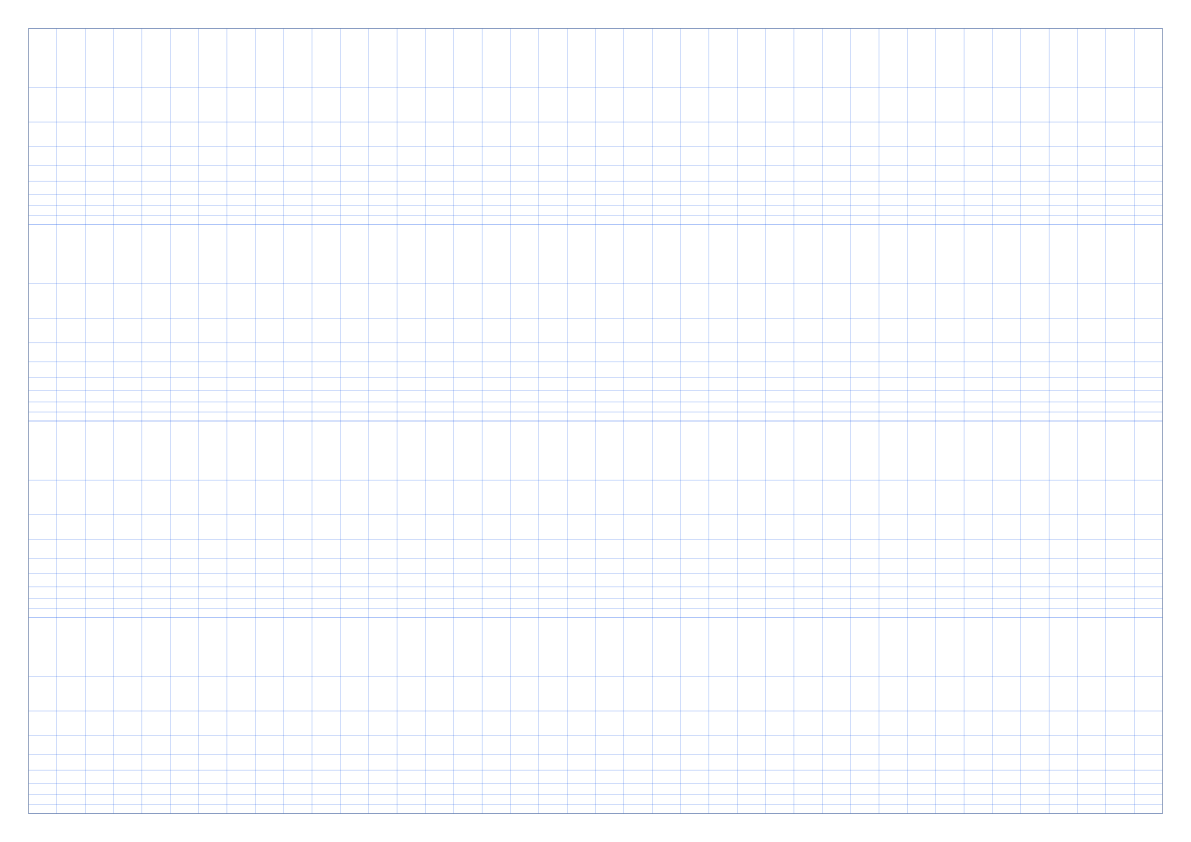
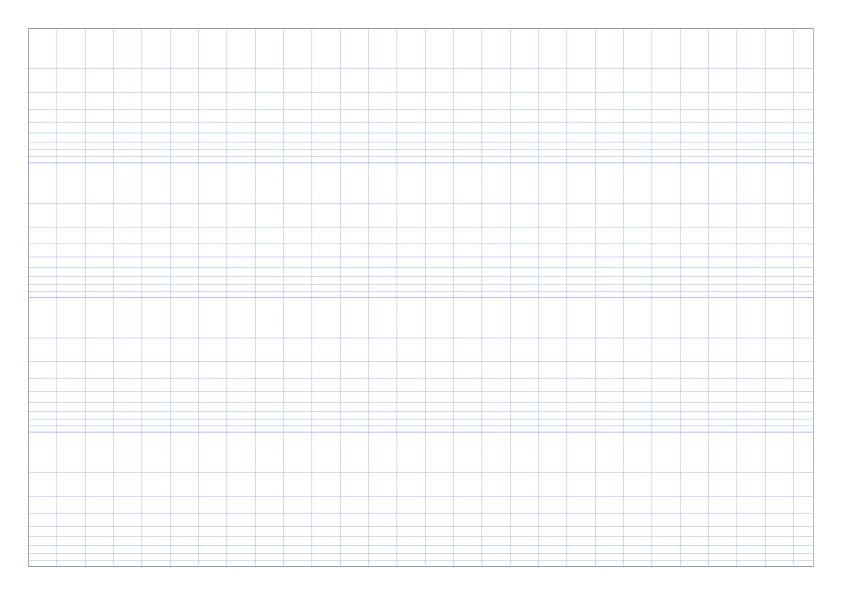
Choose 1-cycle, 2-cycle, 3-cycle, or 4-cycle templates depending on how many orders of magnitude your data needs to show.
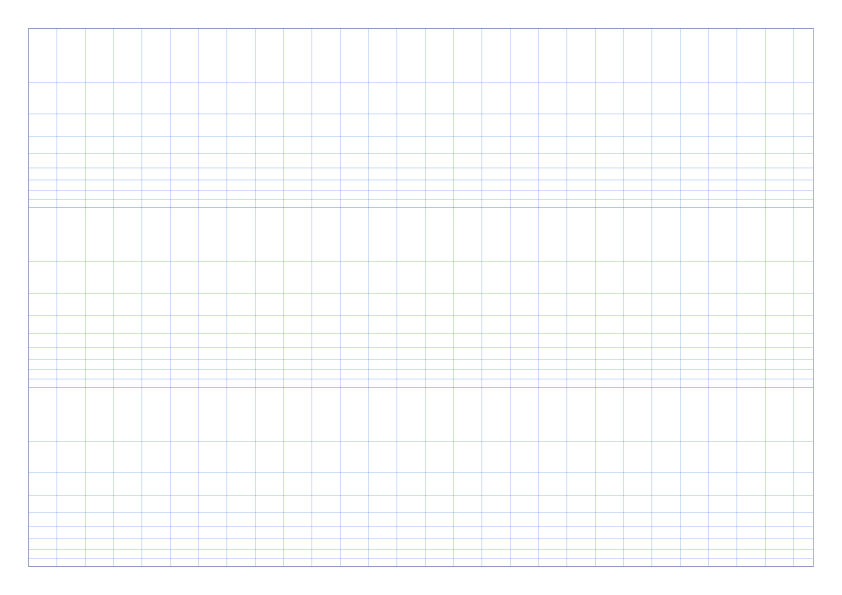
Semi-log PDFs are useful for science labs, electronics, Bode plots, bacterial growth, cooling curves, and half-life charts.
Semi-log paper is used for exponential growth, decay curves, Bode plots, frequency response, bacterial growth, population change, half-life, and measurements spanning powers of ten.
Use 1-cycle for one decade of values, 2-cycle for two decades, 3-cycle for three decades, and 4-cycle when the data spans four orders of magnitude.
Yes. Filter by A4 or open a semi-log template to download A4 semi-log graph paper as a PDF or PNG.