

A4 Semi-Log Grid
Most countries210 x 297 mm (8.27 x 11.69 in)
International home, school, and office printing

Printable Semi-Log Grid
Choose how many base-10 cycles your data spans and the page orientation, then download the matching grid.
Print at Actual Size or 100% so the prepared measurements stay accurate.
Semi-log graph paper uses a logarithmic scale on one axis and an evenly spaced linear scale on the other. Each logarithmic cycle represents a tenfold change, giving small and large values enough room on the same graph.
Use it for exponential growth and decay, population change, cooling curves, frequency response, and measurements that span several powers of ten. Choose the number of log cycles by counting the tenfold ranges in your data—for example, 1 to 1,000 requires three cycles.
Check the size printed on your paper pack or shown in the printer tray. A4 is standard in most countries, while US Letter is standard in the United States and Canada. Choose a larger size only when your printer or print service supports it.
210 x 297 mm (8.27 x 11.69 in)
International home, school, and office printing
8.5 x 11 in (215.9 x 279.4 mm)
US home, school, and office printing
297 x 420 mm (11.69 x 16.54 in)
Engineering sketches and larger diagrams
420 x 594 mm (16.54 x 23.39 in)
Large plans, displays, and technical drawings
8.5 x 14 in (215.9 x 355.6 mm)
Long worksheets, calculations, and plans
11 x 17 in (279.4 x 431.8 mm)
Large handouts, plans, and presentation sheets
18 x 24 in (457.2 x 609.6 mm)
Wall charts, maps, displays, and large plans
The choices below explain what changes and when each option is useful. Make the actual selection in the download panel at the top of the page.
One-cycle semi-log paper is useful for introductory logarithmic plots and data contained within a single tenfold range. A starting value of 1 can cover 1 to 10.
Two-cycle semi-log paper suits growth, decay, and measurement data spanning two tenfold ranges. A starting value of 1 can cover 1 to 100.
Three-cycle semi-log paper is a practical general-purpose choice for science labs, growth and decay curves, and engineering data with a broad range. A starting value of 1 can cover 1 to 1,000.
Four-cycle semi-log paper provides room for wide-range scientific and engineering data spanning four powers of ten. A starting value of 1 can cover 1 to 10,000.
Plot population growth, cooling, radioactive decay, compound change, and other exponential relationships.
Compare measurements that cover several powers of ten while keeping time, distance, or another variable linear.
Use the transformed logarithmic axis to inspect relationships that curve on ordinary linear graph paper.
Choose from 56 ready-made templates. Open a paper-size group, then download the PDF for accurate printing, save a PNG, or customize the same layout in the generator.

A4 portrait · 1 logarithmic cycle · Blue grid

A4 portrait · 2 logarithmic cycles · Blue grid
A4 portrait · 3 logarithmic cycles · Blue grid

A4 portrait · 4 logarithmic cycles · Blue grid

A4 landscape · 1 logarithmic cycle · Blue grid

A4 landscape · 2 logarithmic cycles · Blue grid

A4 landscape · 3 logarithmic cycles · Blue grid

A4 landscape · 4 logarithmic cycles · Blue grid
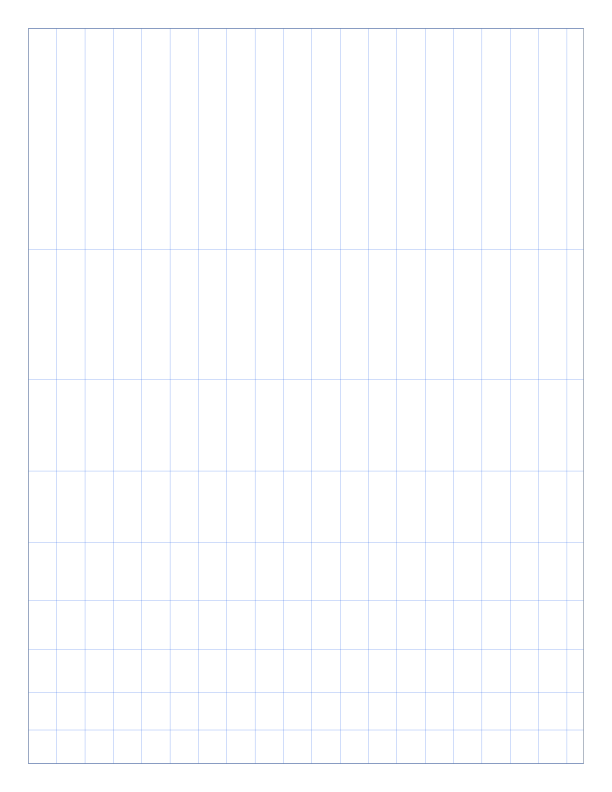
Letter portrait · 1 logarithmic cycle · Blue grid
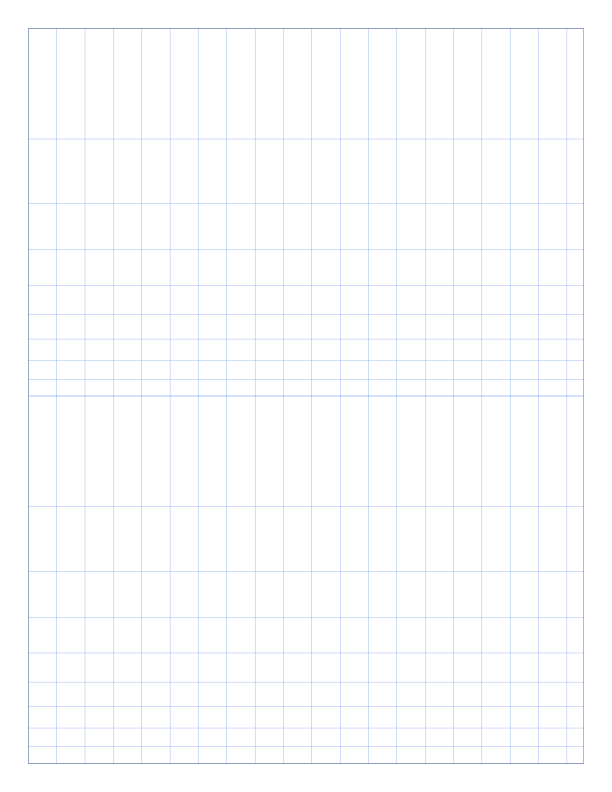
Letter portrait · 2 logarithmic cycles · Blue grid
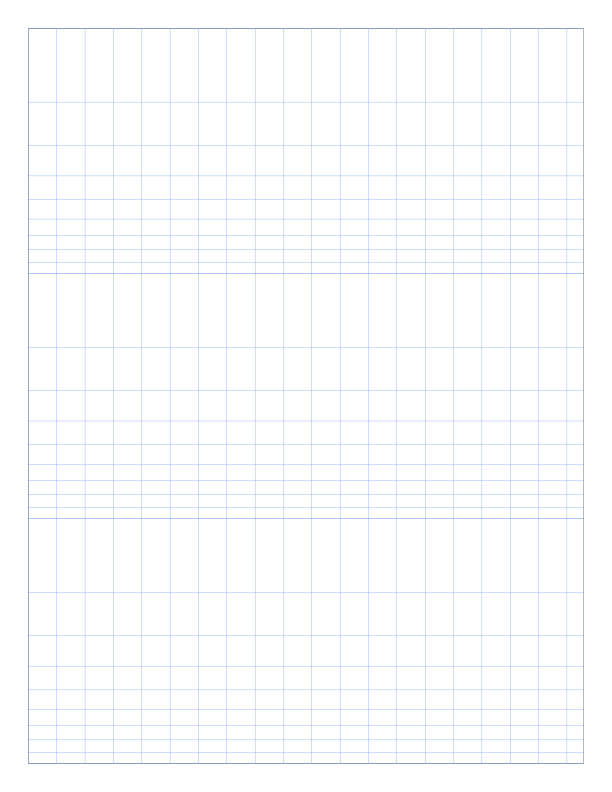
Letter portrait · 3 logarithmic cycles · Blue grid
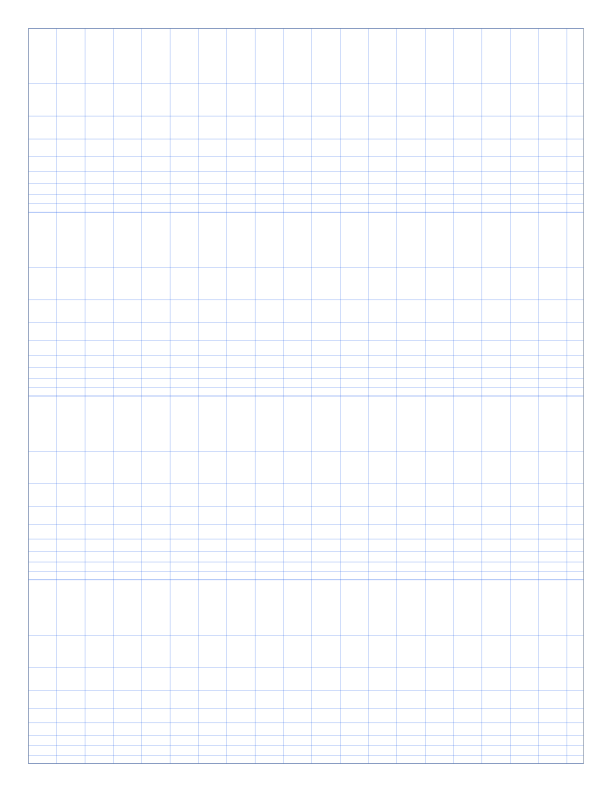
Letter portrait · 4 logarithmic cycles · Blue grid
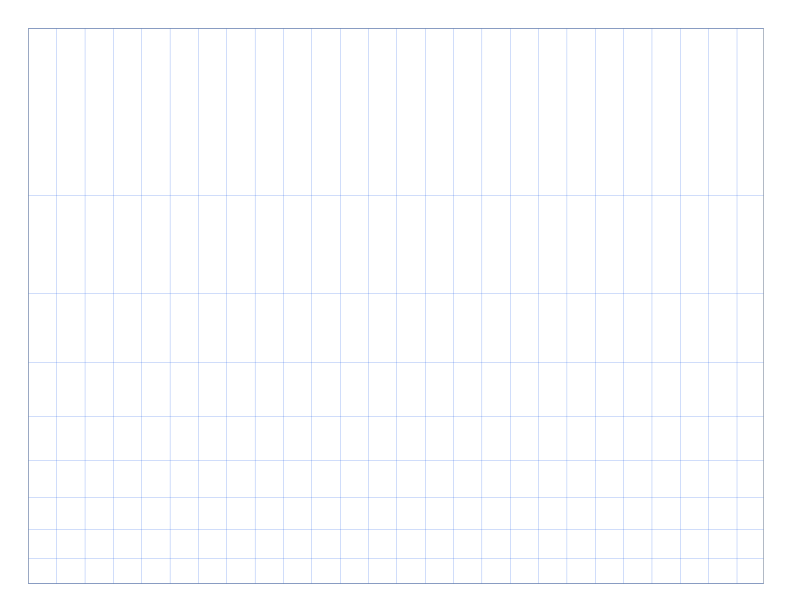
Letter landscape · 1 logarithmic cycle · Blue grid
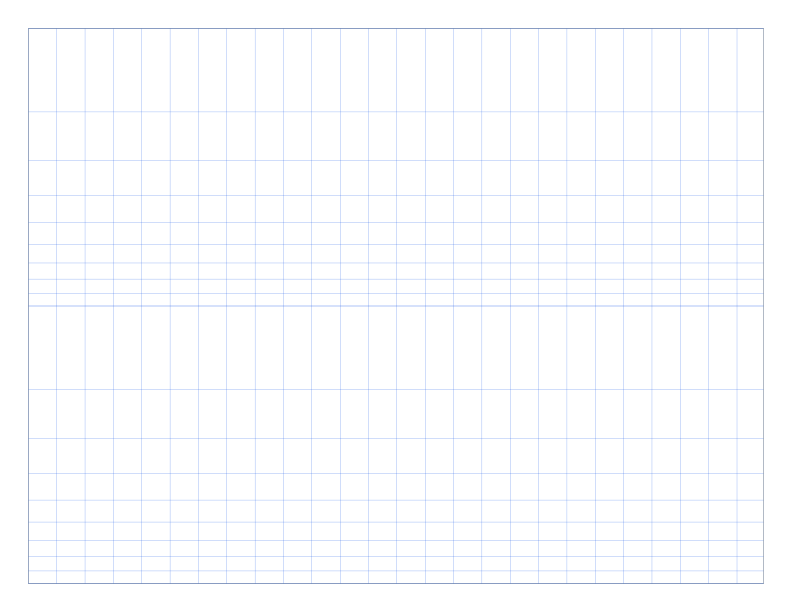
Letter landscape · 2 logarithmic cycles · Blue grid
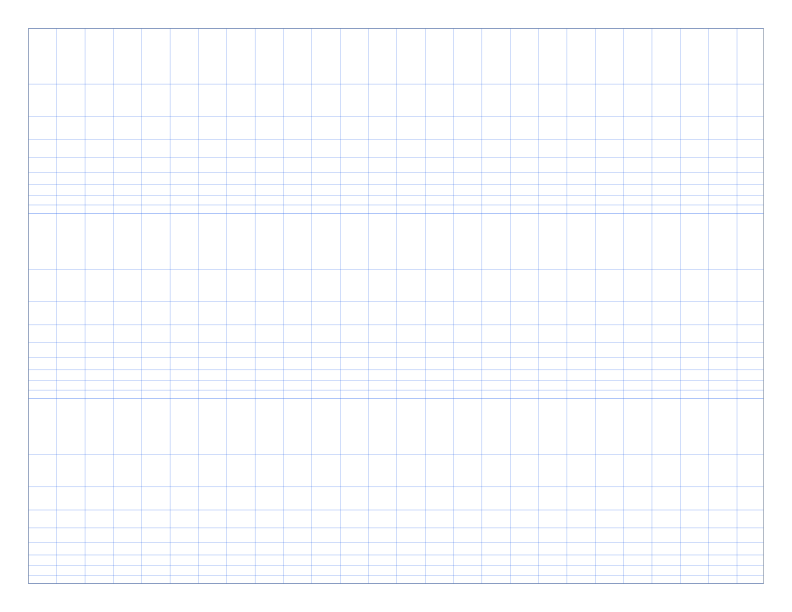
Letter landscape · 3 logarithmic cycles · Blue grid
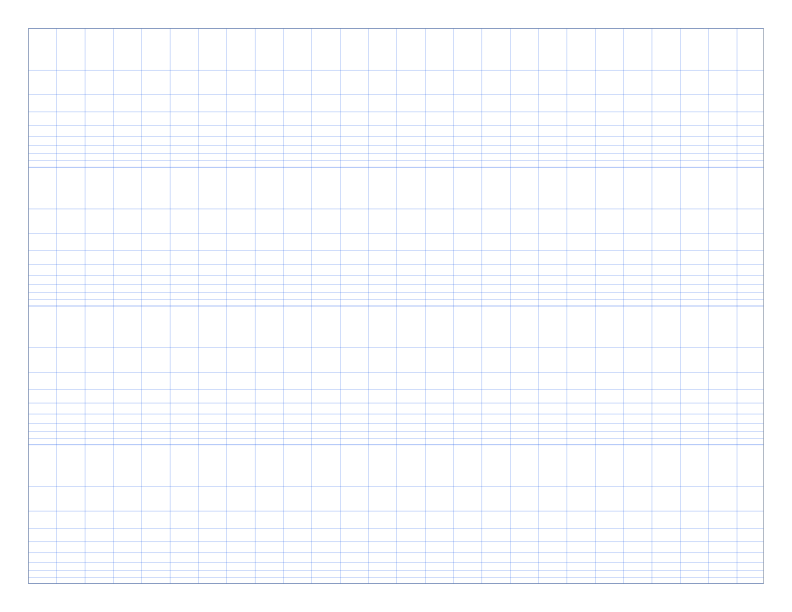
Letter landscape · 4 logarithmic cycles · Blue grid

A3 portrait · 1 logarithmic cycle · Blue grid
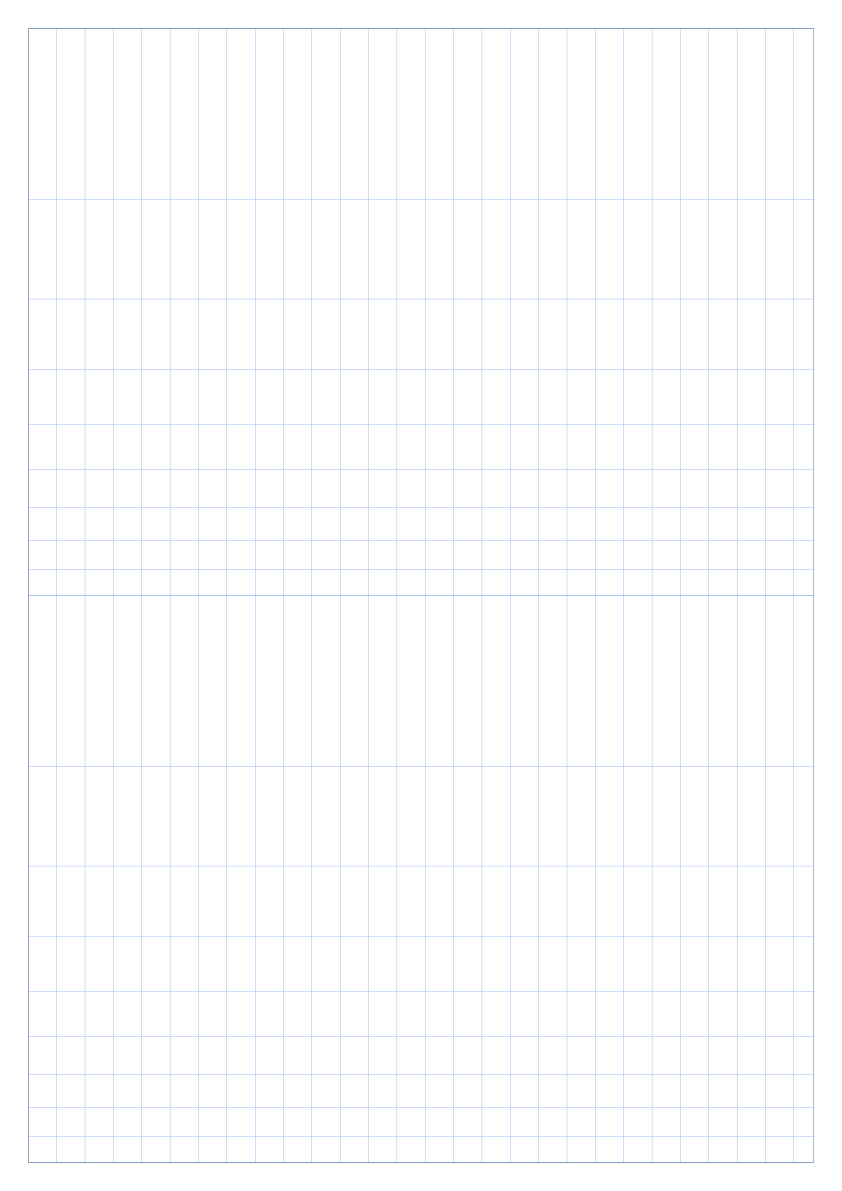
A3 portrait · 2 logarithmic cycles · Blue grid
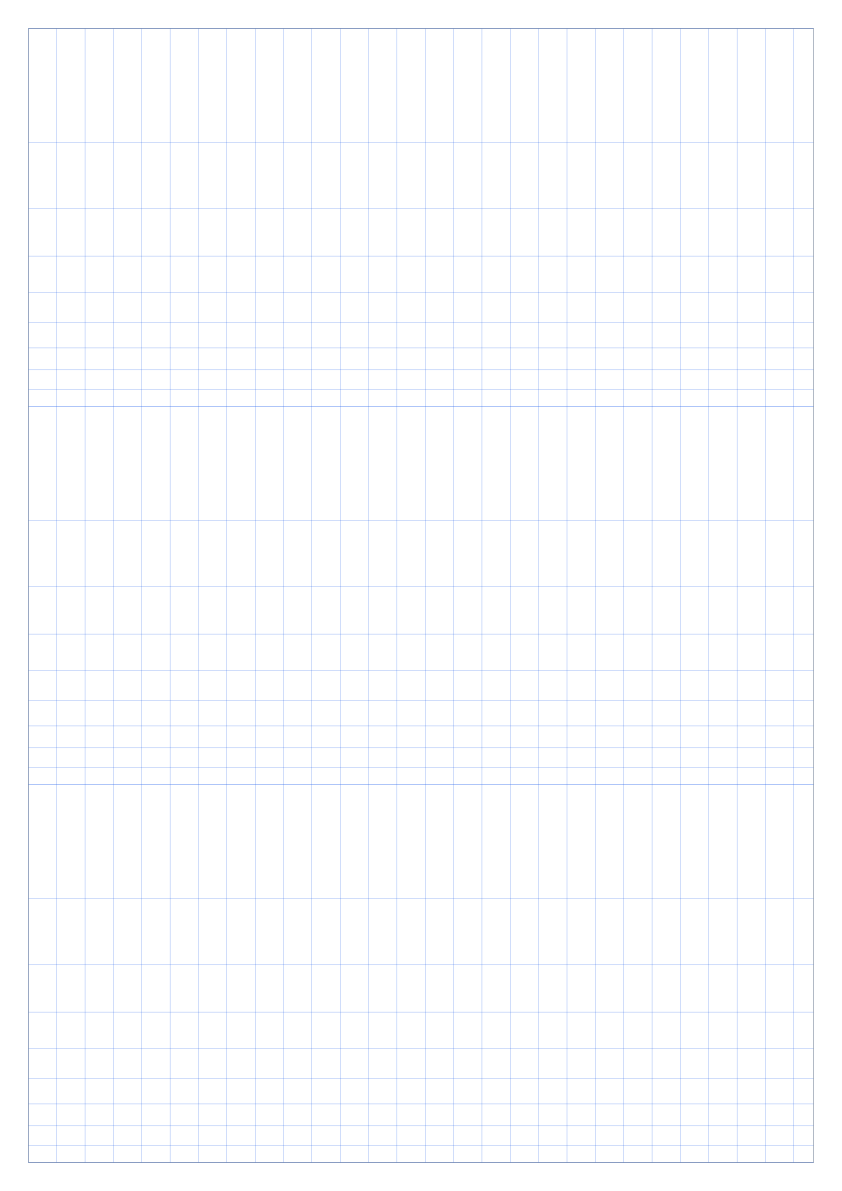
A3 portrait · 3 logarithmic cycles · Blue grid
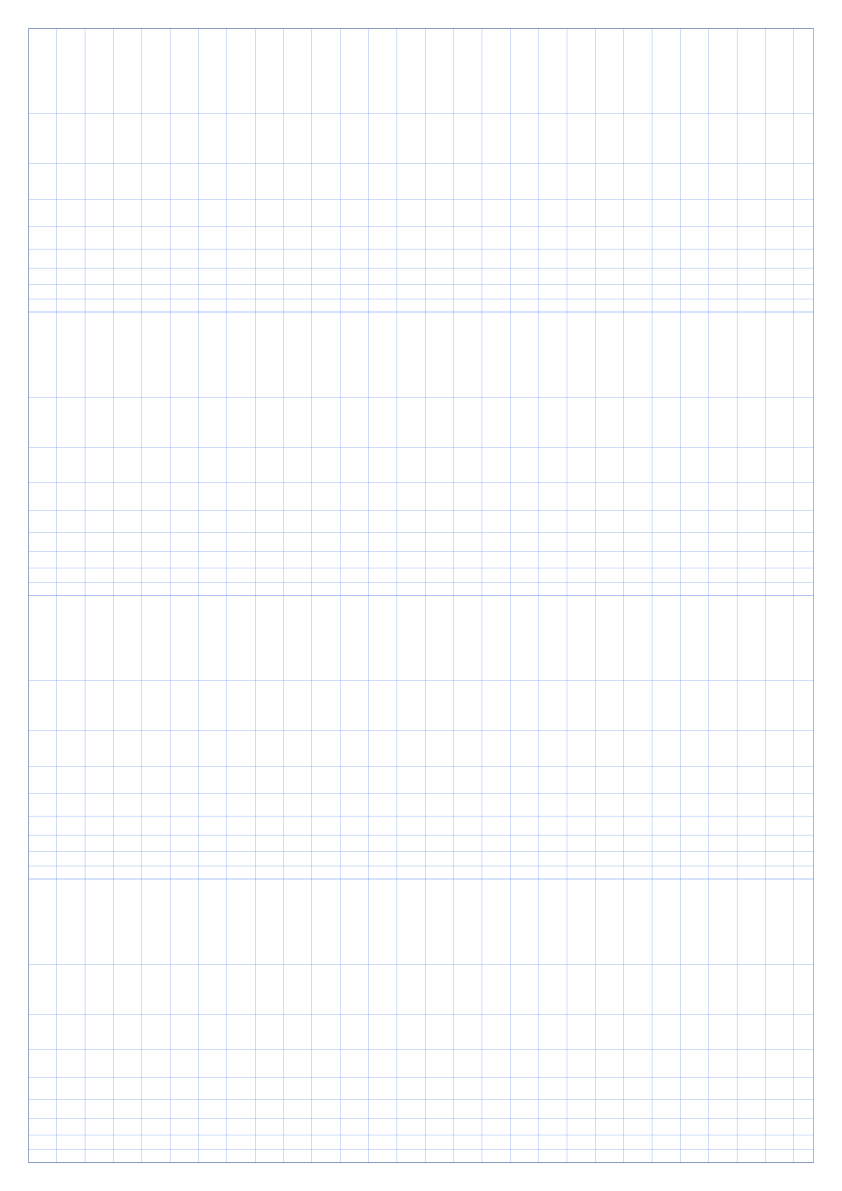
A3 portrait · 4 logarithmic cycles · Blue grid
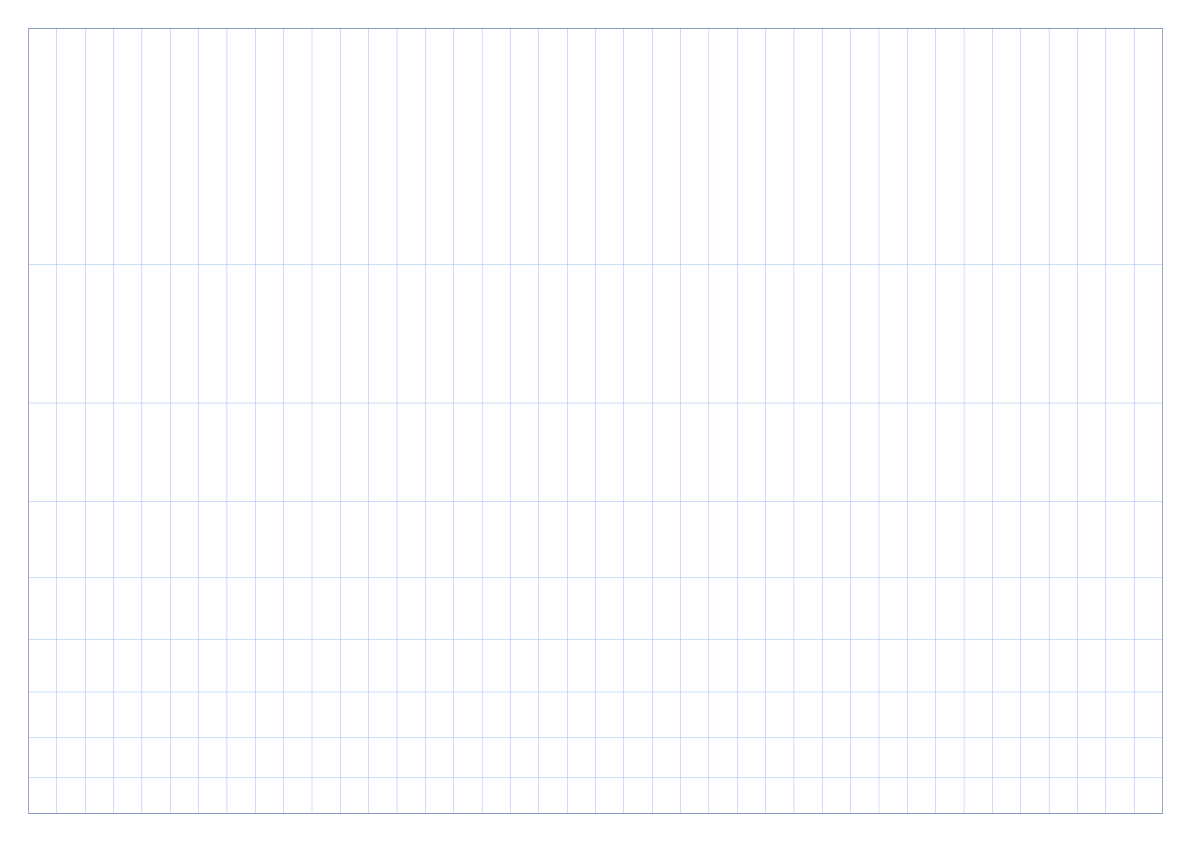
A3 landscape · 1 logarithmic cycle · Blue grid
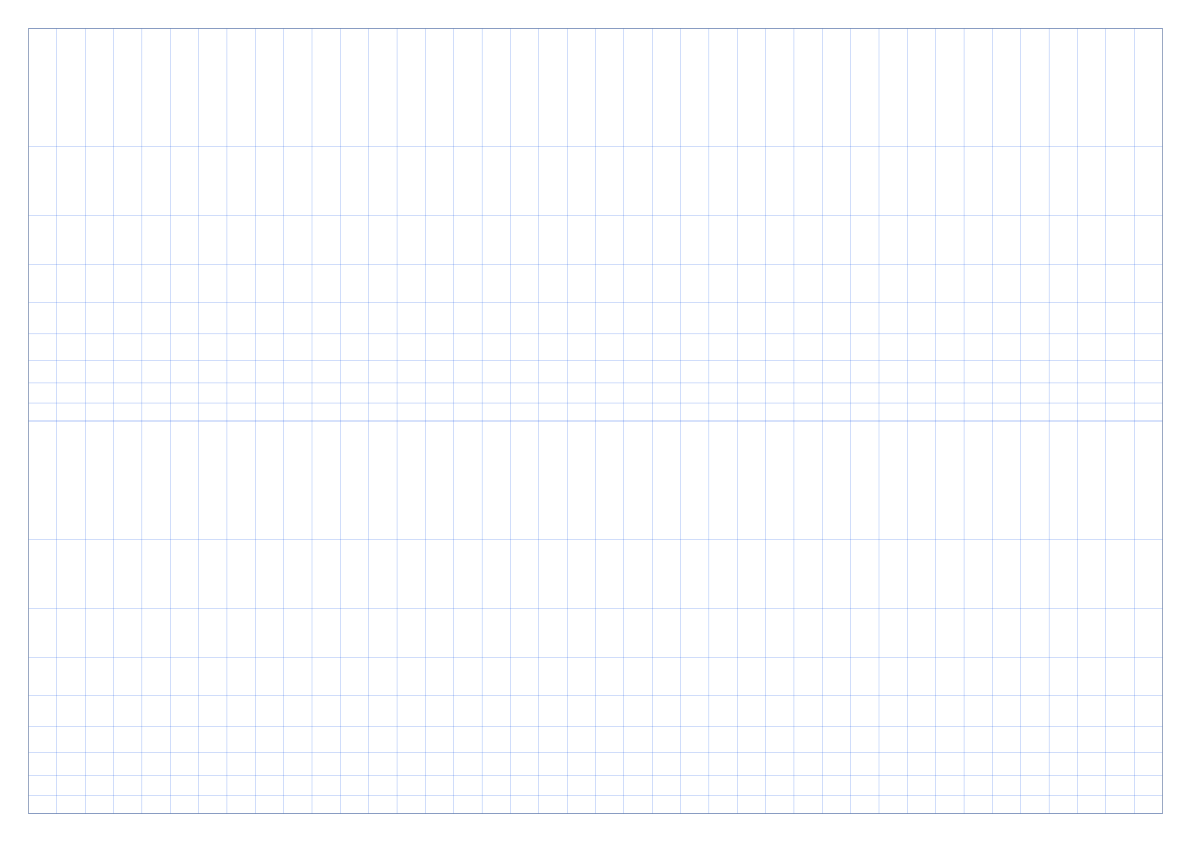
A3 landscape · 2 logarithmic cycles · Blue grid
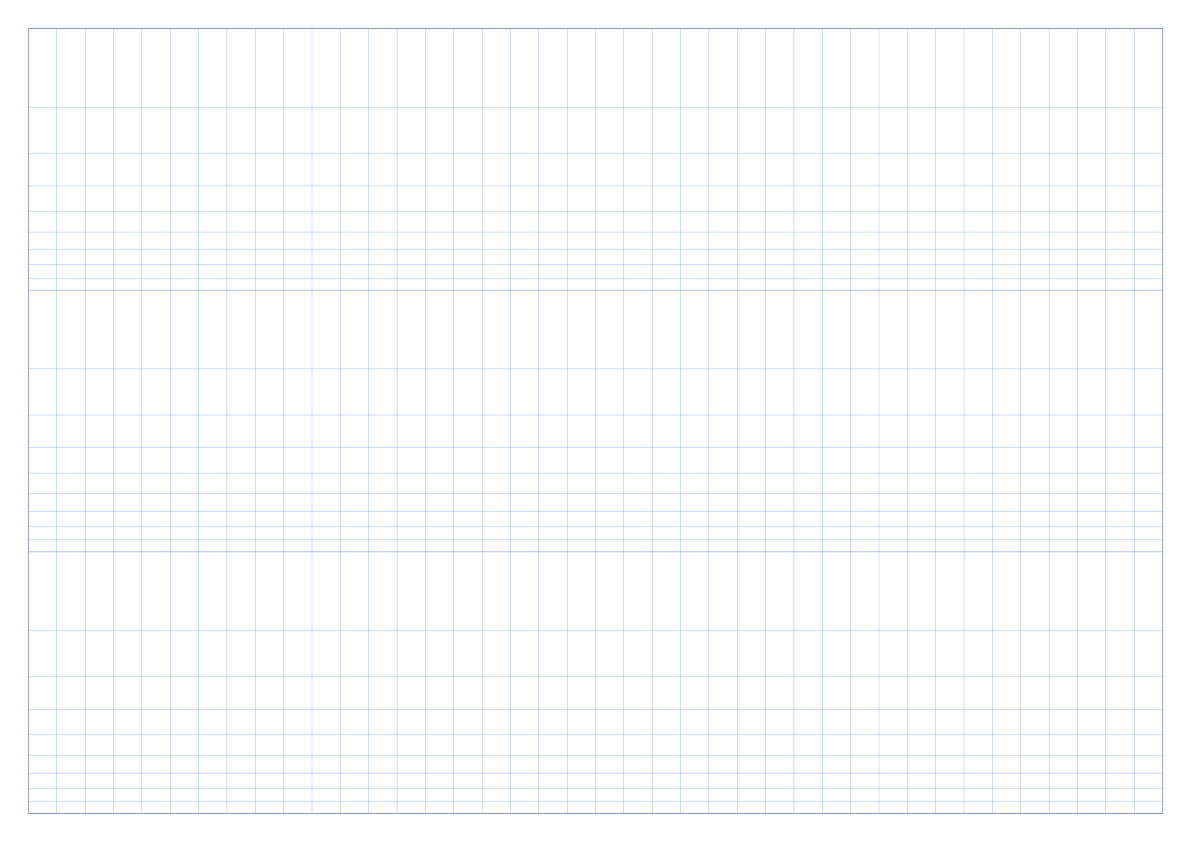
A3 landscape · 3 logarithmic cycles · Blue grid
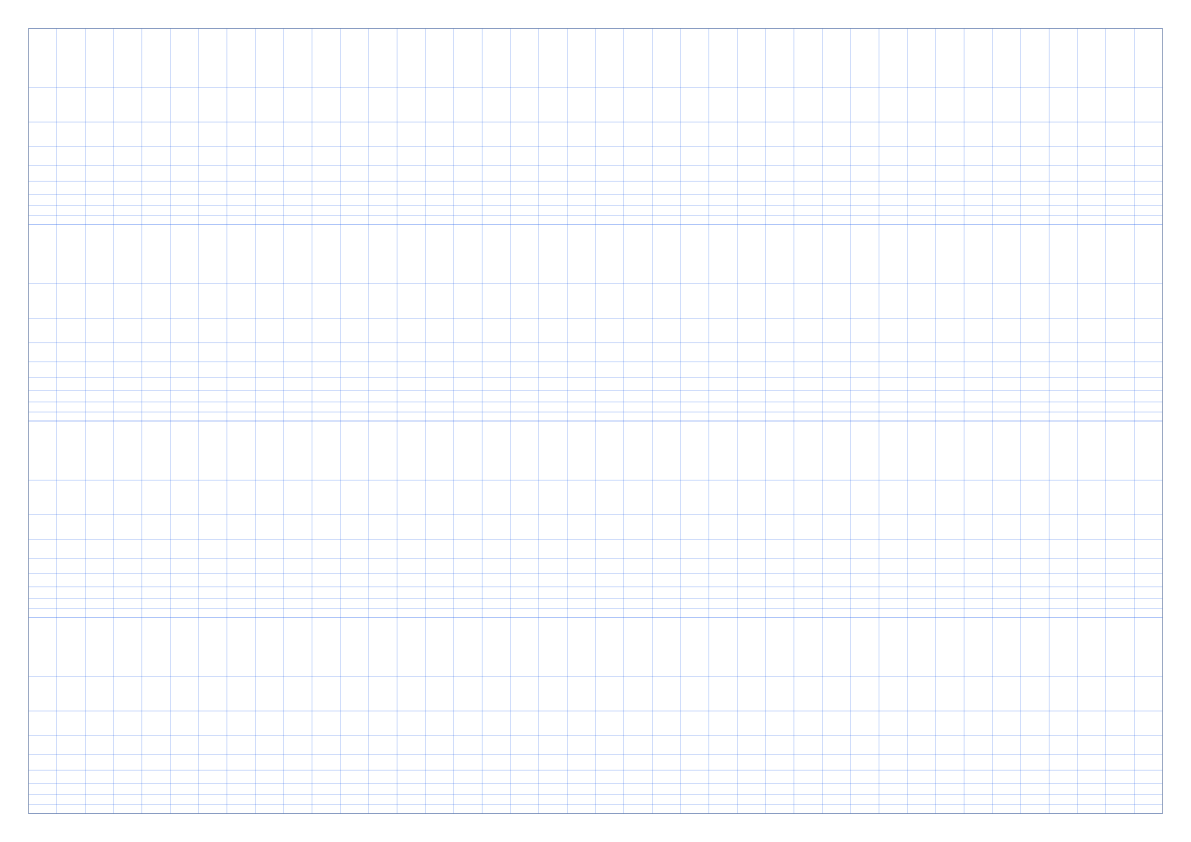
A3 landscape · 4 logarithmic cycles · Blue grid

A2 portrait · 1 logarithmic cycle · Blue grid

A2 portrait · 2 logarithmic cycles · Blue grid

A2 portrait · 3 logarithmic cycles · Blue grid

A2 portrait · 4 logarithmic cycles · Blue grid

A2 landscape · 1 logarithmic cycle · Blue grid

A2 landscape · 2 logarithmic cycles · Blue grid

A2 landscape · 3 logarithmic cycles · Blue grid

A2 landscape · 4 logarithmic cycles · Blue grid
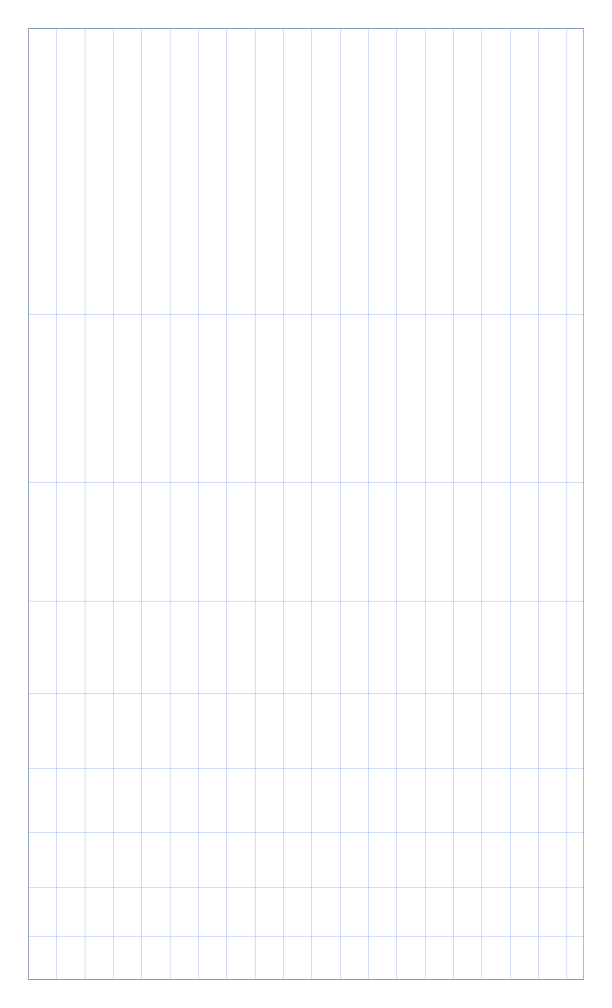
Legal portrait · 1 logarithmic cycle · Blue grid
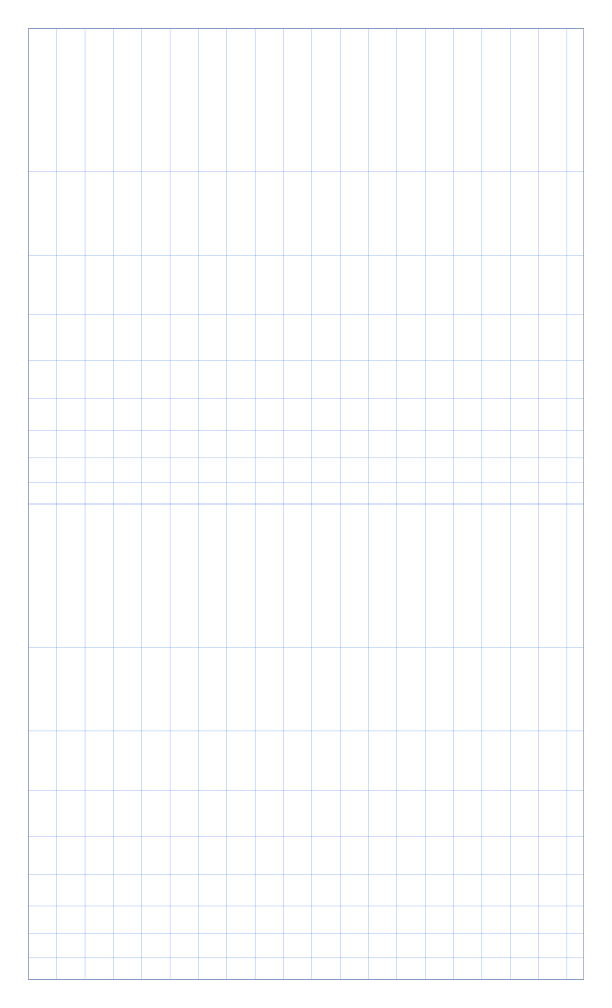
Legal portrait · 2 logarithmic cycles · Blue grid
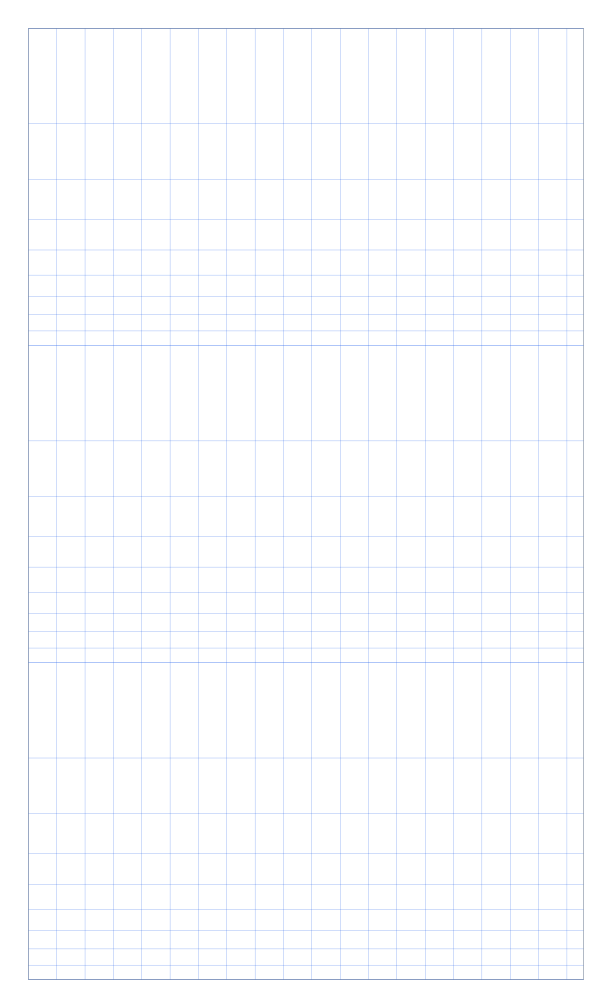
Legal portrait · 3 logarithmic cycles · Blue grid
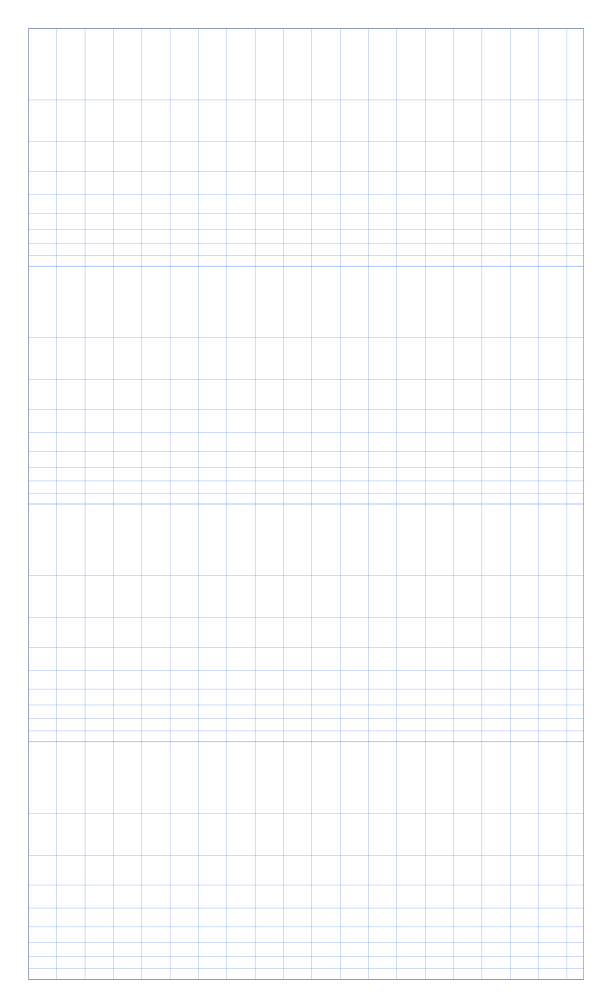
Legal portrait · 4 logarithmic cycles · Blue grid
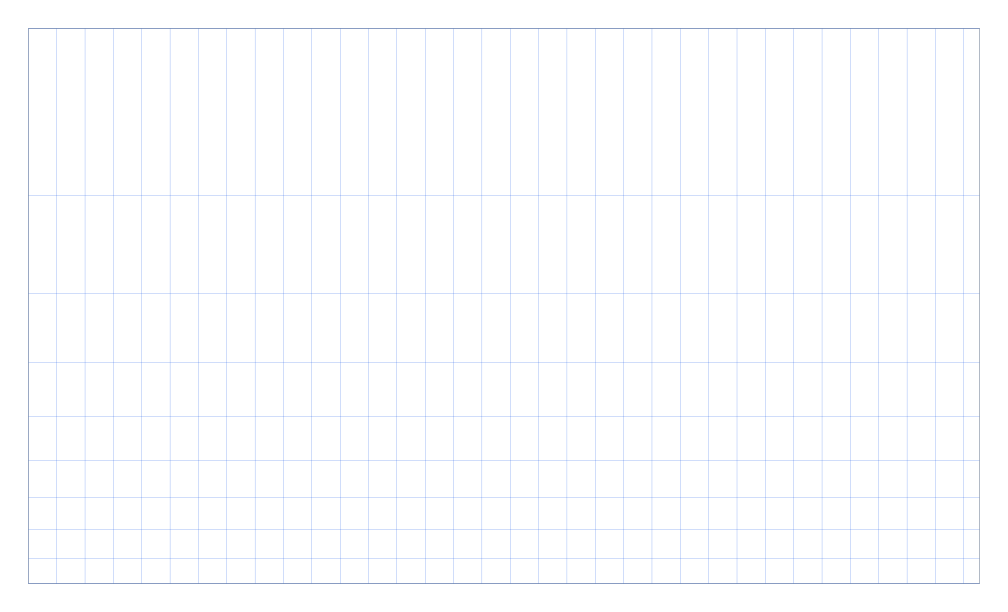
Legal landscape · 1 logarithmic cycle · Blue grid
Legal landscape · 2 logarithmic cycles · Blue grid
Legal landscape · 3 logarithmic cycles · Blue grid
Legal landscape · 4 logarithmic cycles · Blue grid

Tabloid portrait · 1 logarithmic cycle · Blue grid

Tabloid portrait · 2 logarithmic cycles · Blue grid

Tabloid portrait · 3 logarithmic cycles · Blue grid

Tabloid portrait · 4 logarithmic cycles · Blue grid

Tabloid landscape · 1 logarithmic cycle · Blue grid

Tabloid landscape · 2 logarithmic cycles · Blue grid

Tabloid landscape · 3 logarithmic cycles · Blue grid

Tabloid landscape · 4 logarithmic cycles · Blue grid

Poster portrait · 1 logarithmic cycle · Blue grid

Poster portrait · 2 logarithmic cycles · Blue grid

Poster portrait · 3 logarithmic cycles · Blue grid
Poster portrait · 4 logarithmic cycles · Blue grid

Poster landscape · 1 logarithmic cycle · Blue grid
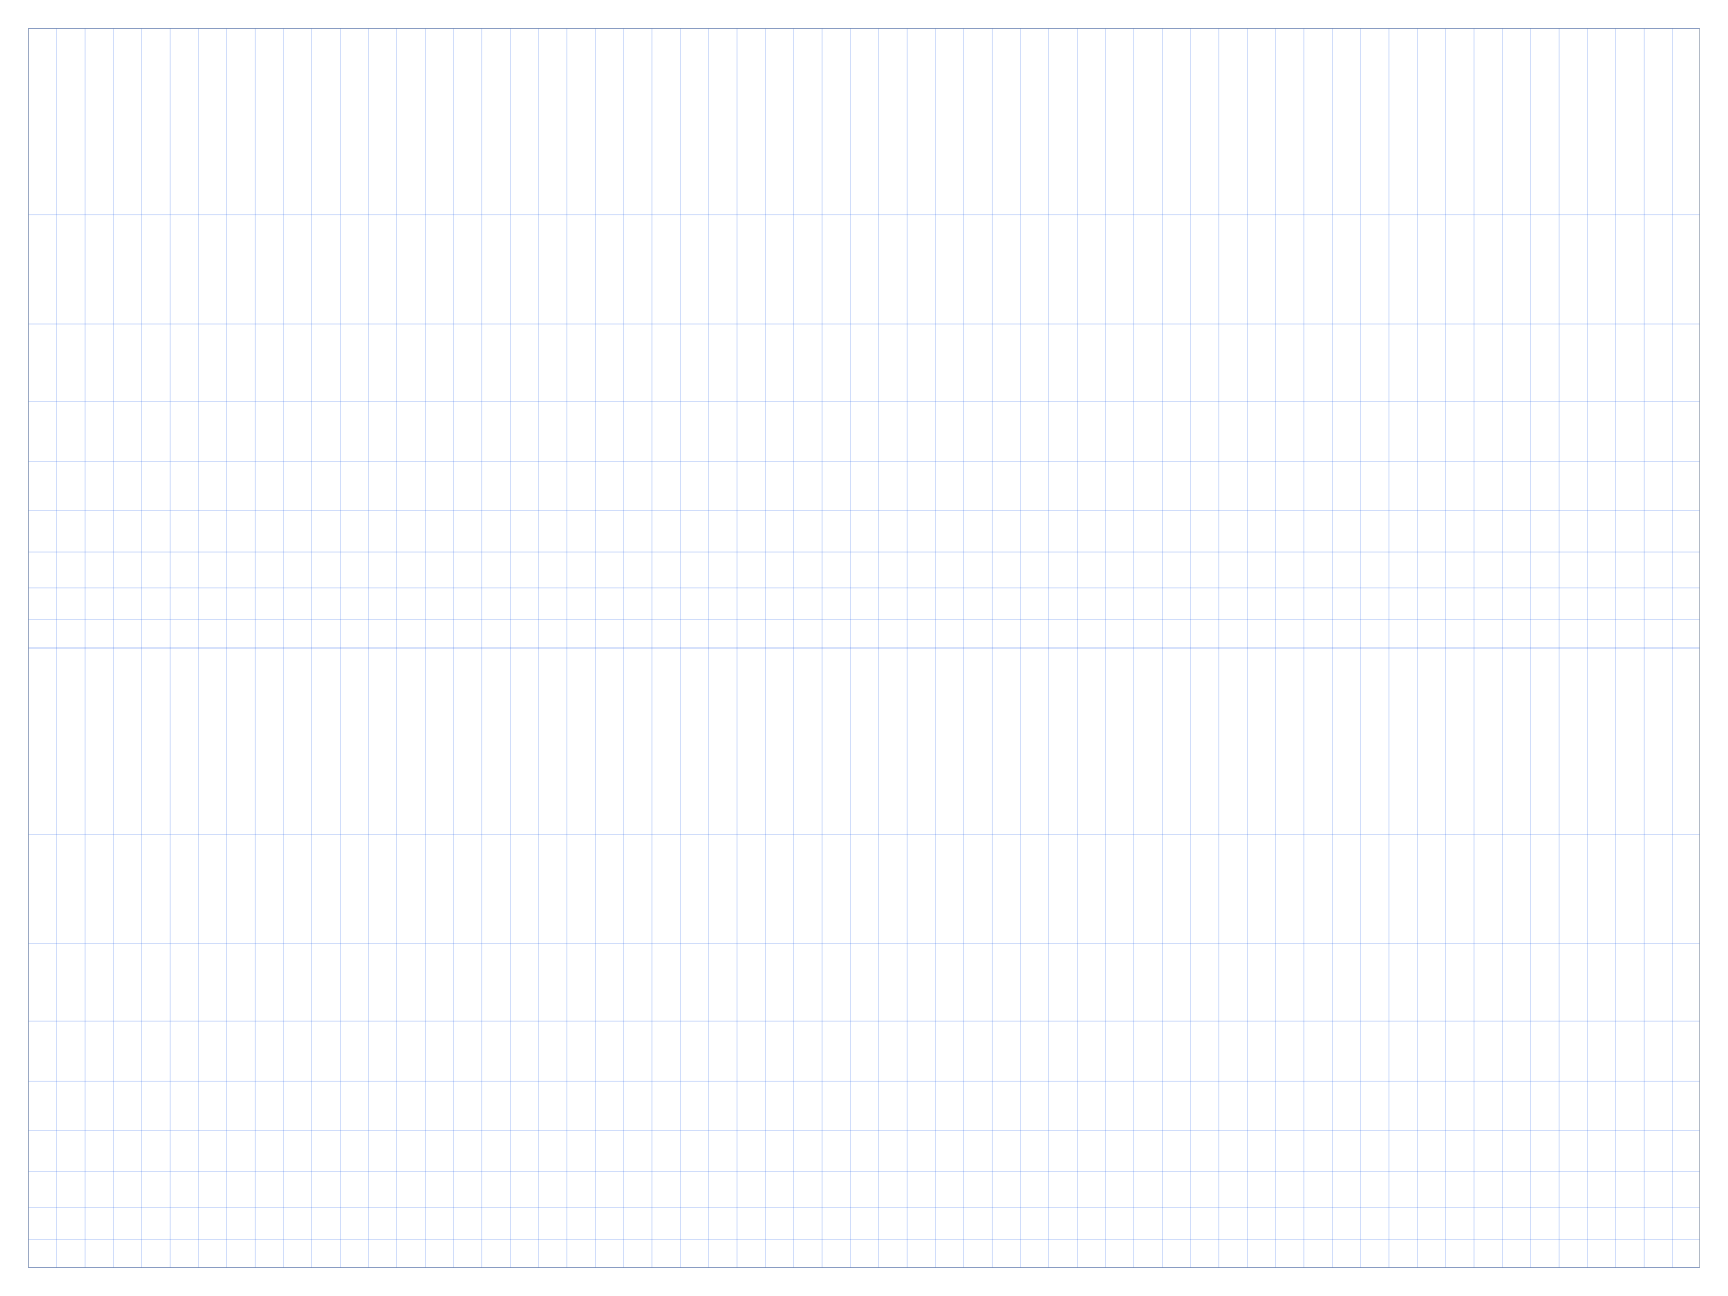
Poster landscape · 2 logarithmic cycles · Blue grid

Poster landscape · 3 logarithmic cycles · Blue grid
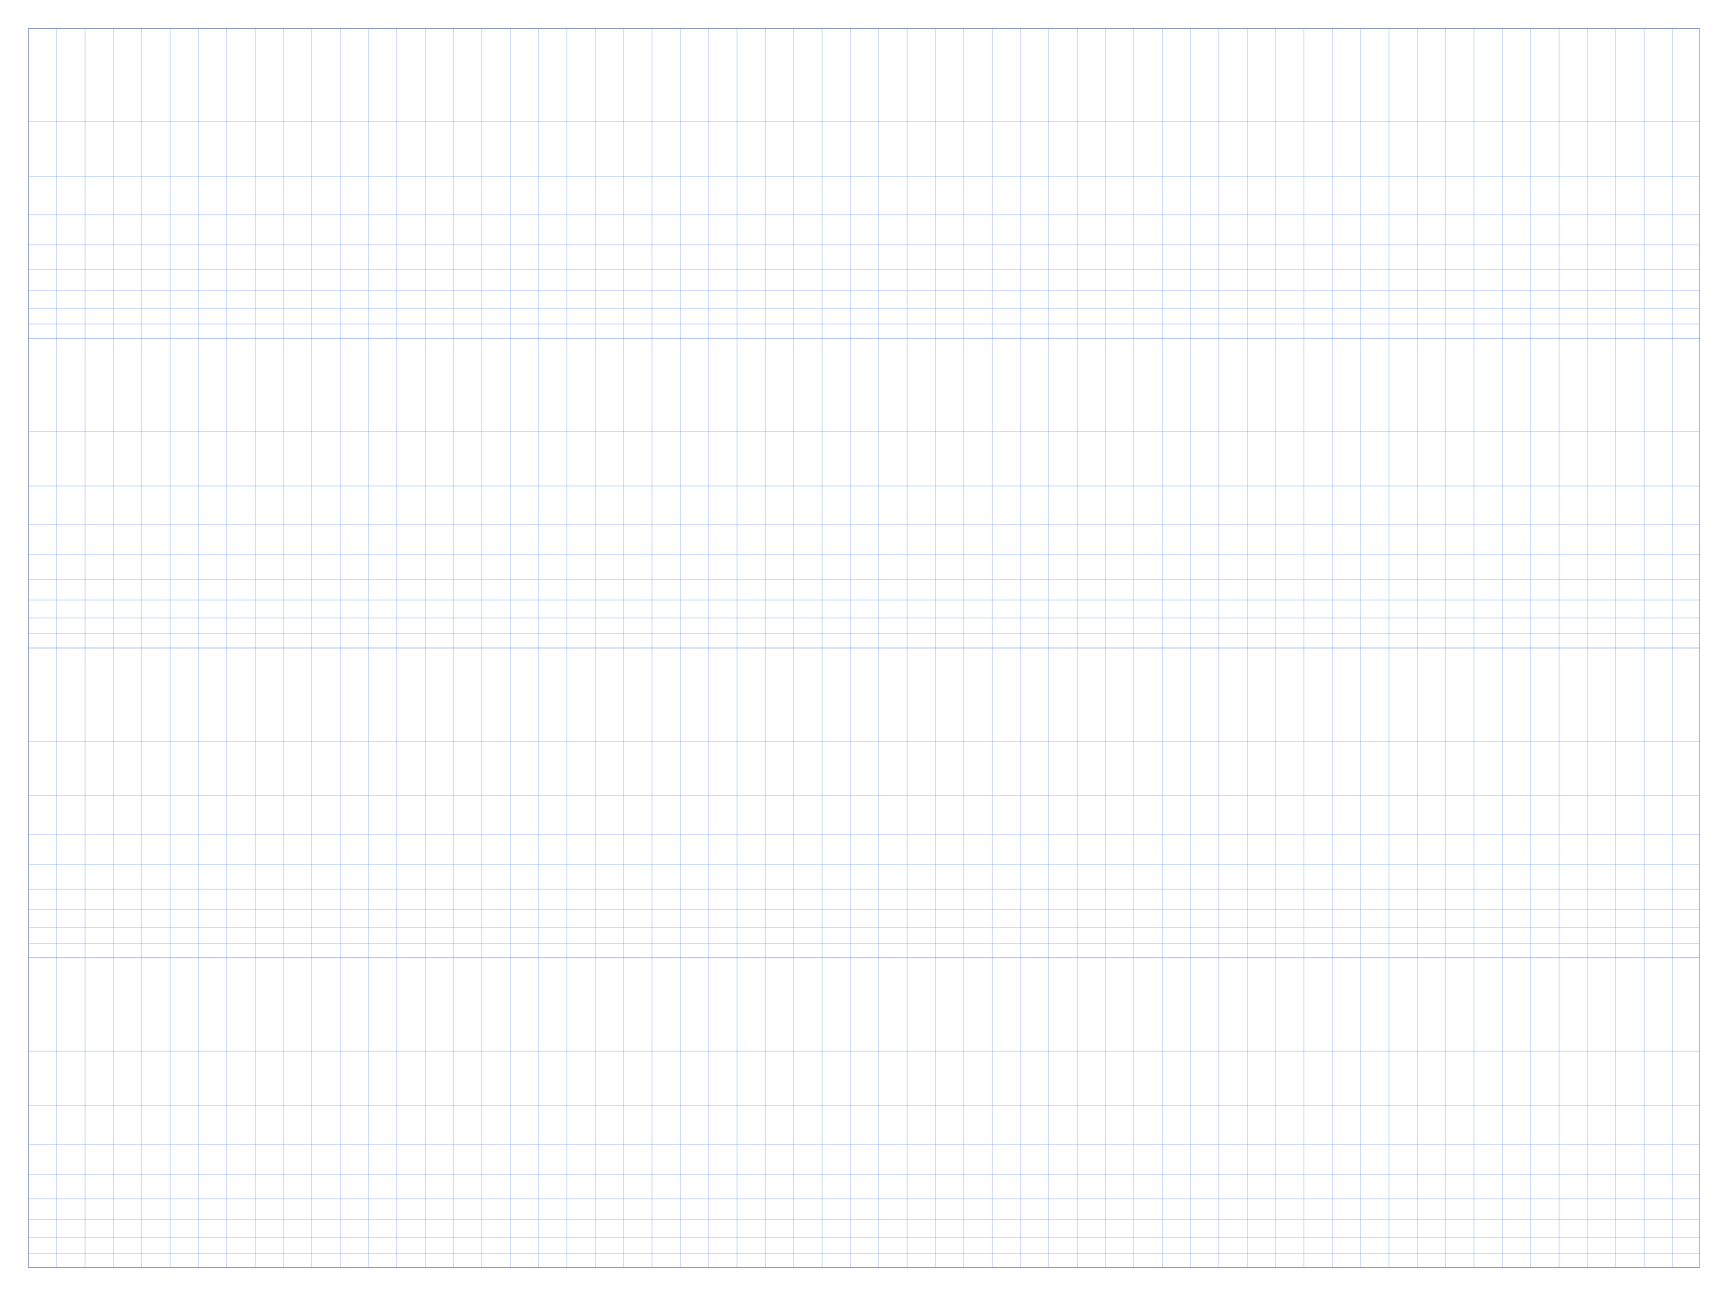
Poster landscape · 4 logarithmic cycles · Blue grid
Answers about choosing, downloading, customizing, and printing this paper.
Count the powers of ten in the data range. Values from 1 to 1,000 need three cycles; values from 1 to 10,000 need four.
The prepared resources use a logarithmic Y-axis and a linear X-axis. Use the generator if you need the logarithmic scale on the X-axis instead.
Open the Semi-Log Grid Generator →Label each major cycle boundary with the power of ten required by your data. Within a cycle, the minor lines represent 2 through 9 times the value at the beginning of that cycle.
Choose PDF when you want to print at an accurate physical size. Use PNG for notes, worksheets, and image-based documents. Choose SVG when you need an editable vector file for a drawing or design application.
Portrait gives you more vertical working room for worksheets, notes, and tall diagrams. Landscape gives you more horizontal room for charts, maps, tables, timelines, and wide drawings. The prepared measurements stay the same in either orientation when you print at 100%.
The print dialog probably scaled the page. Print the PDF at Actual Size or 100%, and turn off Fit to Page, Shrink, and other automatic scaling options. The paper size selected in the print dialog must also match the file you downloaded.